EDDIE
Frequently Asked Questions (FAQs)
What datasets can I access?
- Adult Lead
- Air Quality
- Behavioral Risk Factor Surveillance System (BRFSS)
- Birth Defects
- Births
- Cancer Incidence
- Carbon Monoxide Poisoning Mortality
- Childhood Cancer Incidence
- Childhood Lead Poisoning
- Children Less Than Age 5 in Poverty
- Communicable Diseases (Other than STD)
- Deaths
- Drinking Water Quality
- Hospitalization Admissions
- Hospitalization Discharges
- Housing by Year Built
- Infant Deaths
- Population
- Reported Pregnancies
- Reproductive Health Outcomes
- Sexually Transmitted Diseases
Where can I find the most recent data?
All of the data on our website are the most recent finalized data available. Because of the time required to collect, process, validate, and correct the data, the finalized data we publish may be behind by a few years. For more information please review the
EDDIE Data Release Schedule (XLSX).
Where can I find help on a particular menu or a data column?
Click on the menu title or the data column title within EDDIE to open up a help file. The help files will explain both the menu and the data column.
What if I have technical questions about the type of statistics displayed?
Our website has a section on
Understanding Health Statistics. In particular the
Tools of Trade articles explain statistical concepts on significance testing, surveys, confidence intervals, age-adjusted rates, crude/age-specific rates, and more.
What population is used to calculate rates in EDDIE?
Since public health assessment relies extensively on the use of rates to represent the health status of a particular community, the denominators used in the calculation of rates are of considerable importance. The most commonly used denominator is the number of residents of an area. For most populations, actual counts are only available from the decennial census. As a result, population estimates are typically used as the basis for rates in the years between censuses. Since health status tends to vary by such socio-demographic characteristics as age, race/ethnicity, and sex; population estimates by these characteristics are extremely useful and these estimates are often sought for different levels of geography including the state and counties.
The U.S. Census Bureau enumerates the population every ten years. In other years, federal, state, and local governments and various private companies prepare intercensal and postcensal population estimates and projections for selected geographic units. Estimates made by these sources often differ due to differences in their estimation and projection methods, underlying assumptions, type of data used, and familiarity with idiosyncrasies of a population’s demographic history. Since rates are affected by the population estimates that are used as denominators, the use of a common set of estimates among those routinely preparing state and local health statistics is strongly recommended for the sake of comparability.
State and county population estimates for Pennsylvania as of July 1 for intercensal years were produced jointly by the United States Bureau of the Census and the Pennsylvania State Data Center of the Pennsylvania State University at Harrisburg under the Federal-State Cooperative Program for Local Population Estimates. All population data for Census years (1990, 2000 and 2010) used in EDDIE are U.S. Bureau of the Census enumerated population figures as of April 1 of the Census year.
Population data by race and Hispanic origin for non-census years were also produced and released by the Pennsylvania State Data Center. Please note that the population estimates for non-census years that appear in EDDIE are the original figures as first released. Racial and Hispanic origin population data for 1990, 2000 and 2010 are Bureau of the Census enumerated figures.
Respondents to the 2000 and 2010 Censuses were able to select multiple races for racial designation. Beginning in 2013, population data by race in EDDIE has a "Multi-Race" category that includes residents who selected more than one race. Among Pennsylvania residents, only 1.9 percent selected multiple races on the 2010 Census form.
Do I have to select from all categories in order to run my query?
Yes. By default, the first item in each category is selected. Querying the data by selecting the first item in each category will typically produce the broadest data table available. The data table can be expanded by making multiple selections within each category or by selecting more specific items within each category.
Why is nothing happening when I click "Create Table?"
Tables are created below the selection categories, which may be outside the display window on smaller screens. Try scrolling down to see the table. If a table is still not being displayed, keep in mind that, the more records being queried, the longer a query may take. If a large query is taking too long to return a table, try narrowing it down or breaking it into several smaller queries.
For questions about data, contact the Division of Health Informatics at 717-782-2448, or email
RA-DH-EDDIE@pa.gov.
What are the data sources for EDDIE?
| Adult Lead | Pennsylvania National Electronic Disease Surveillance System |
| Air Quality | Pennsylvania Department of Environmental Protection Air Quality Dataset |
| Behavioral Risk Factor Surveillance System (BRFSS) | Pennsylvania Behavioral Risk Factor Surveillance System (BRFSS) |
| Birth Defects | Pennsylvania Birth Certificate Dataset |
| Births | Pennsylvania Birth Certificate Dataset |
| Cancer Incidence | Pennsylvania Cancer Registry Dataset |
| Carbon Monoxide Poisoning Mortality | Pennsylvania Death Certificate Dataset |
| Childhood Cancer Incidence | Pennsylvania Cancer Registry Dataset |
| Childhood Lead Poisoning | Pennsylvania National Electronic Disease Surveillance System |
Children Less Than Age 5 Living in Poverty
| American Community Survey (ACS) |
| Communicable Diseases (Other than STD) | Pennsylvania Department of Health, Bureau of Communicable Diseases |
| Deaths | Pennsylvania Certificates of Death |
| Drinking Water Quality | Pennsylvania Department of Environmental Protection |
| Hospitalization Admissions | Pennsylvania Health Care Cost Containment Council (PHC4) |
| Hospitalization Discharges | Pennsylvania Health Care Cost Containment Council (PHC4) |
| Housing by Year Built | American Community Survey (ACS) |
| Infant Deaths | Pennsylvania Certificates of Death |
| Population | U.S. Bureau of Census for 1990, 2000 and 2010. Pennsylvania State Data Center at Penn State Harrisburg for non-census years. |
| Reported Pregnancies | Pennsylvania Birth Certificate, Pennsylvania Fetal Death Certificate Dataset, and Pennsylvania Induced Abortion Dataset. |
| Reproductive Health Outcomes | Pennsylvania Certificates of Live Births, Fetal Death Certificates and/or Death Certificates |
| Sexually Transmitted Diseases (STDs) | Pennsylvania Department of Health, Bureau of Communicable Diseases |
Are there privacy restrictions in EDDIE?
Yes. EDDIE data can only be used for aggregate statistical reporting and analysis. The data and reports that are available through EDDIE are for public use and do not include personal information that would identify an individual.
How are small data values protected to avoid revealing the identities of individual people?
Age-adjusted rates will not be shown for counts less than 20 due to unreliability of such calculations based on small numbers. For similar reasons all other rates, ratios, or percentages will not be shown for counts less than 10. In the cancer datasets, if the population is less than 300 then the frequency count and rate will be suppressed. Suppression within EDDIE protects the identities of individuals, and insures reasonable data quality.
How do I export my query result?
EDDIE allows several outputs for a researcher to display the results of a query. First of all, the query results are displayed on the computer screen and provide a visual table. You may then click on the export button,  , that is located above the table. There are five types of output you can choose from:
-
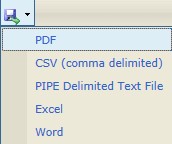 PDF file that can be opened in Adobe Acrobat Reader
 - Comma separated value (CSV) file
- Pipe-delimited text file
- Excel document file
- Word document file
When Excel is chosen from the drop down list, the resulting file will contain much of the formatting of the visual table on the website, so it is recommended that CSV be chosen to export if further data manipulation in Excel is needed. The CSV file can be opened and saved by Excel.
Can I custom sort my table?
Every column in a table can be sorted by clicking the arrow button of a particular column name. Clicking the sort button again will sort the data in the reverse order.
Can I create maps in EDDIE?
Yes. Pennsylvania choropleth maps can be created in the EDDIE system for most of the datasets. However, you may need to change the geography selection in menu 3, Select a Geography, before a map option appears in menu 4, Select a Report. Typically a map option is not available for a geography selection of "State" or "Municipality".
After selecting “Map” and proceeding to the next page, a new set of menus will appear. Selections must be made in each menu in order for a map to be generated. After making the desired selections, the map can be customized using the “Map Settings” menu.
Map data can be classified into three types: optimal, equal interval, or equal distribution.
Optimal: Creates ranges that automatically adjust distribution to create balanced sub-ranges. The number of sub-ranges is determined by the algorithm.
Equal interval: Create ranges that divide the data into equal range intervals. This method does not take into account how the data is distributed. Very large values or very small values can skew the distribution results.
Equal Distribution: Create ranges that divide that data so that each range has a balanced number of items. This method can skew the distribution by creating divisions that span very large or very small ranges.
The color palette, transparency and number of classes for each data classification type can also be customized within the Map Settings menu.
Can I create charts in EDDIE?
Yes. Vertical bar and trend line charts can be created in the EDDIE system for select datasets. However, you may need to change the geography selection in menu 3, Select a Geography, before a chart option appears in menu 4, Select a Report. Typically a chart option is not available for a geography selection of "Municipality".
After selecting “Chart” and proceeding to the next page, a new set of menus will appear. Selections must be made in each menu in order for a map to be generated. After making the desired selections, the chart settings menu can be used to select either a vertical bar chart or a trend line chart. The "Show table below chart" checkbox is selected by default. If this checkbox is unselected, only the desired chart will be visible in the output; however, the underlying data can still be seen in the chart by hovering your mouse over a specific data point or bar.