Tables and trend lines by topic
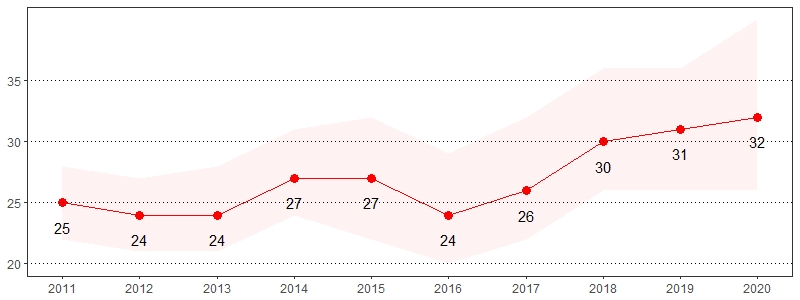
Alcohol Consumption, Pennsylvania Adults, 2020
| Binge Drinking* ** | At Risk for Problem Drinking* *** | Chronic Drinking* **** | ||||
|---|---|---|---|---|---|---|
| Demographics | % | CI | % | CI | % | CI |
| All adults | 17 | 15-18 | 7 | 7-8 | 7 | 6-8 |
| Gender | ||||||
| Male | 21 | 19-23 | 8 | 6-9 | 11 | 9-12 |
| Female | 13 | 11-15 | 7 | 6-9 | 4 | 3-5 |
| Age | ||||||
| 18-29 | 28 | 24-33 | 9 | 7-12 | 9 | 6-11 |
| 30-44 | 23 | 20-26 | 10 | 8-12 | 8 | 7-11 |
| 45-64 | 16 | 14-18 | 8 | 7-10 | 8 | 7-10 |
| 65+ | 5 | 3-6 | 3 | 2-5 | 5 | 4-6 |
| Education | ||||||
| < High school | 11 | 7-16 | 4 | 2-7 | 4 | 2-8 |
| High school | 15 | 13-18 | 7 | 5-8 | 7 | 6-9 |
| Some college | 20 | 17-23 | 9 | 7-11 | 8 | 6-10 |
| College degree | 17 | 16-19 | 8 | 7-10 | 8 | 7-10 |
| Household income | ||||||
| < $15,000 | 17 | 11-24 | 7 | 4-11 | 8 | 5-14 |
| $15,000 to $24,999 | 9 | 7-13 | 5 | 3-8 | 5 | 3-8 |
| $25,000 to $49,999 | 16 | 13-20 | 6 | 5-9 | 6 | 4-8 |
| $50,000 to $74,999 | 19 | 16-23 | 8 | 6-11 | 10 | 8-13 |
| $75,000+ | 21 | 19-24 | 10 | 8-12 | 9 | 8-11 |
| Race | ||||||
| White, non-Hispanic | 17 | 16-19 | 8 | 7-9 | 8 | 7-9 |
| Black, non-Hispanic | 17 | 13-22 | 7 | 5-10 | 7 | 4-10 |
| Hispanic | 16 | 12-23 | 5 | 3-9 | 5 | 3-8 |
*Excludes missing, don't know and refused
**Defined as having five or more drinks on one occasion for men and having four or more drinks on one occasion for women
***Defined as adult men having more than two drinks per day and adult women having more than one drink per day
****Defined as having an average of two drinks or more every day for the past 30 days
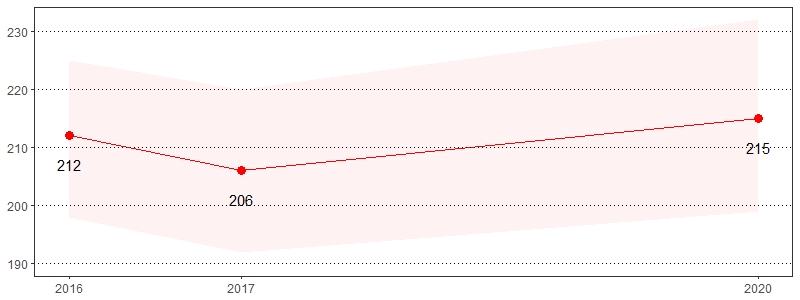
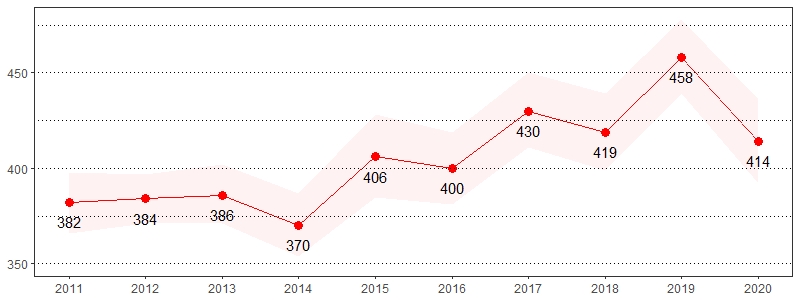
Alcohol Consumption Prevalence per 1,000 Pennsylvania Population,
Pennsylvania Adults, 2011-2020
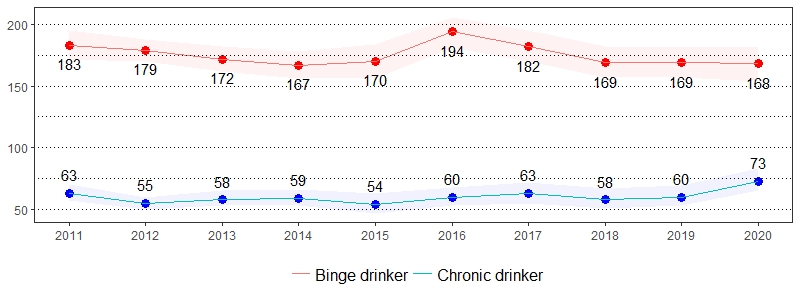
Color bands around estimates show 95% confidence intervals
Arthritis, Pennsylvania Adults, 2020
| Ever Told Have Some Form of Arthritis* | ||
|---|---|---|
| Demographics | % | CI |
| All adults | 29 | 27-30 |
| Gender | ||
| Male | 23 | 21-25 |
| Female | 34 | 32-36 |
| Age | ||
| 18-29 | 5 | 3-8 |
| 30-44 | 11 | 9-14 |
| 45-64 | 34 | 31-37 |
| 65+ | 57 | 53-60 |
| Education | ||
| < High school | 33 | 27-41 |
| High school | 32 | 29-35 |
| Some college | 31 | 28-34 |
| College degree | 21 | 19-23 |
| Household income | ||
| < $15,000 | 47 | 39-55 |
| $15,000 to $24,999 | 39 | 34-44 |
| $25,000 to $49,999 | 33 | 29-37 |
| $50,000 to $74,999 | 29 | 25-34 |
| $75,000+ | 19 | 17-21 |
| Race | ||
| White, non-Hispanic | 31 | 30-33 |
| Black, non-Hispanic | 25 | 21-30 |
| Hispanic | 17 | 12-23 |
*Excludes missing, don't know and refused
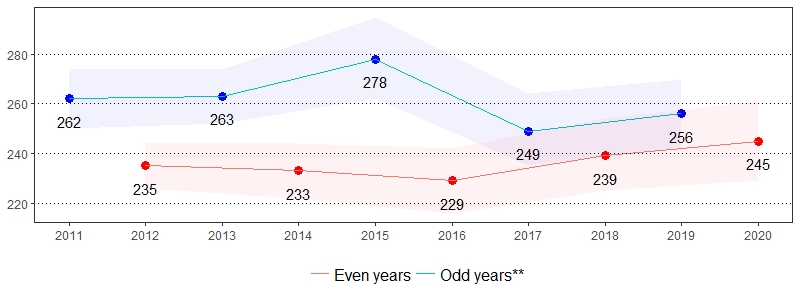
Arthritis Prevalence per 1,000 Pennsylvania Population,
Pennsylvania Adults, 2011-2020
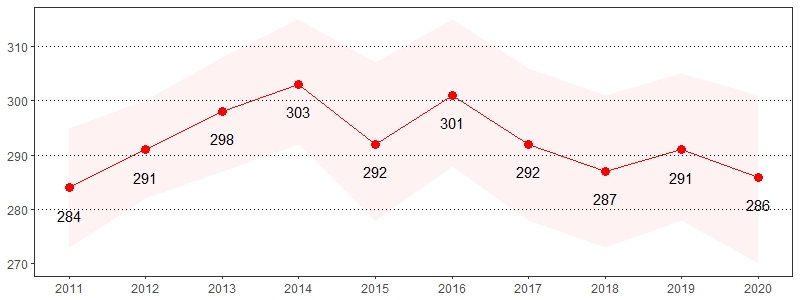
Color bands around estimates show 95% confidence intervals
Asthma, Pennsylvania Adults, 2020
| Ever Told Have Asthma* | Currently Has Asthma* | |||
|---|---|---|---|---|
| Demographics | % | CI | % | CI |
| All adults | 15 | 14-17 | 10 | 9-11 |
| Gender | ||||
| Male | 12 | 11-14 | 7 | 6-8 |
| Female | 18 | 16-20 | 13 | 12-15 |
| Age | ||||
| 18-29 | 21 | 18-25 | 12 | 9-15 |
| 30-44 | 18 | 15-21 | 11 | 9-14 |
| 45-64 | 13 | 11-15 | 11 | 9-13 |
| 65+ | 10 | 9-13 | 7 | 6-9 |
| Education | ||||
| < High school | 19 | 14-25 | 14 | 9-20 |
| High school | 14 | 12-17 | 9 | 8-11 |
| Some college | 17 | 14-20 | 12 | 10-15 |
| College degree | 14 | 12-16 | 8 | 7-10 |
| Household income | ||||
| < $15,000 | 23 | 17-28 | 16 | 11-22 |
| $15,000 to $24,999 | 18 | 15-22 | 12 | 10-16 |
| $25,000 to $49,999 | 17 | 14-20 | 13 | 10-16 |
| $50,000 to $74,999 | 12 | 9-17 | 7 | 5-10 |
| $75,000+ | 13 | 11-16 | 8 | 6-10 |
| Race | ||||
| White, non-Hispanic | 14 | 13-16 | 9 | 8-11 |
| Black, non-Hispanic | 19 | 15-24 | 14 | 10-18 |
| Hispanic | 23 | 17-31 | 16 | 11-23 |
*Excludes missing, don't know and refused
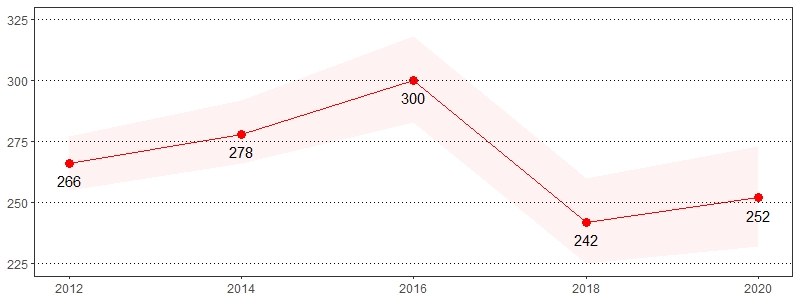
Asthma Prevalence per 1,000 Pennsylvania Population,
Pennsylvania Adults, 2011-2020
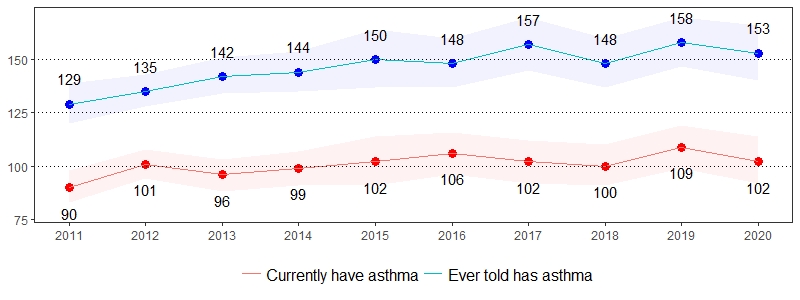
Color bands around estimates show 95% confidence intervals
Breast Cancer Screening, Pennsylvania Women, Age 40+, 2020
| Ever Had a Mammogram* | Had a Mammogram in the Past Year* | |||
|---|---|---|---|---|
| Demographics | % | CI | % | CI |
| Gender | ||||
| Female | 92 | 90-93 | 56 | 53-59 |
| Age | ||||
| 40-49 | 77 | 71-82 | 45 | 38-52 |
| 50-64 | 95 | 92-96 | 64 | 60-68 |
| 65-74 | 97 | 95-99 | 63 | 57-69 |
| 75+ | 95 | 89-98 | 42 | 35-51 |
| Education | ||||
| < High school | 91 | 81-96 | NSR | NSR |
| High school | 89 | 85-92 | 56 | 51-62 |
| Some college | 94 | 91-96 | 54 | 48-60 |
| College degree | 93 | 90-95 | 59 | 54-63 |
| Household income | ||||
| < $15,000 | 84 | 72-92 | NSR | NSR |
| $15,000 to $24,999 | 91 | 87-95 | 52 | 44-61 |
| $25,000 to $49,999 | 90 | 83-94 | 58 | 51-65 |
| $50,000 to $74,999 | 95 | 91-97 | 55 | 46-63 |
| $75,000+ | 92 | 89-94 | 60 | 55-65 |
| Race | ||||
| White, non-Hispanic | 93 | 91-94 | 55 | 52-59 |
| Black, non-Hispanic | 89 | 82-93 | 66 | 57-74 |
| Hispanic | 90 | 79-95 | NSR | NSR |
*Excludes missing, don't know and refused
Note: If "NSR" is displayed, then the total response is less than 50 and/or the percentage prevalence is considered "not statistically reliable."
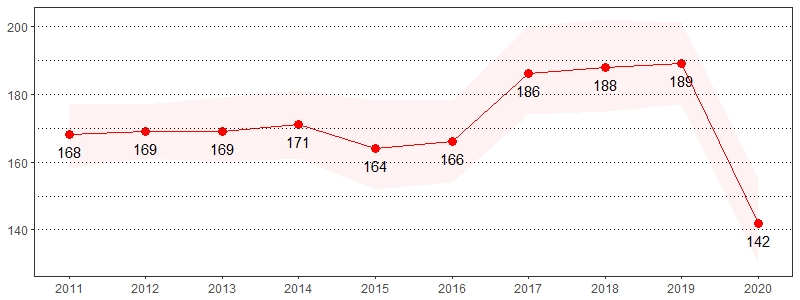
Had a Mammogram in the Past Year Prevalence per 1,000 Pennsylvania Population,
Pennsylvania Women, Age 40+, 2012-2020
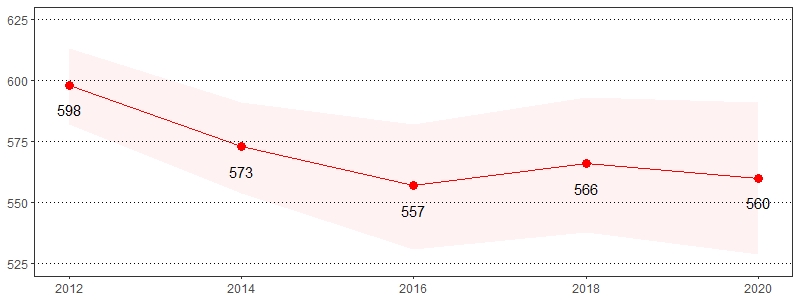
Color bands around estimates show 95% confidence intervals
Cancer, Pennsylvania Adults, 2020
| Ever Told Had Skin Cancer* | Ever Told Had Any Other Type of Cancer* |
|||
|---|---|---|---|---|
| Demographics | % | CI | % | CI |
| All adults | 7 | 6-8 | 8 | 7-9 |
| Gender | ||||
| Male | 6 | 5-8 | 7 | 6-9 |
| Female | 7 | 6-8 | 8 | 7-10 |
| Age | ||||
| 18-29 | 0 | 0-1 | 0 | 0-2 |
| 30-44 | 1 | 1-2 | 3 | 2-7 |
| 45-64 | 7 | 6-9 | 7 | 6-9 |
| 65+ | 17 | 14-19 | 19 | 17-22 |
| Education | ||||
| < High school | 2 | 1-5 | 11 | 7-19 |
| High school | 7 | 5-8 | 8 | 7-10 |
| Some college | 7 | 5-9 | 8 | 6-10 |
| College degree | 8 | 7-10 | 6 | 5-7 |
| Household income | ||||
| < $15,000 | 4 | 2-9 | 9 | 5-14 |
| $15,000 to $24,999 | 5 | 3-7 | 10 | 7-13 |
| $25,000 to $49,999 | 8 | 6-10 | 10 | 7-14 |
| $50,000 to $74,999 | 6 | 5-9 | 7 | 5-10 |
| $75,000+ | 8 | 6-10 | 7 | 5-9 |
| Race | ||||
| White, non-Hispanic | 8 | 7-9 | 9 | 8-10 |
| Black, non-Hispanic | 1 | 0-4 | 6 | 4-10 |
| Hispanic | 2 | 1-5 | 3 | 1-6 |
*Excludes missing, don't know and refused
Cancer Prevalence per 1,000 Pennsylvania Population,
Pennsylvania Adults, 2011-2020
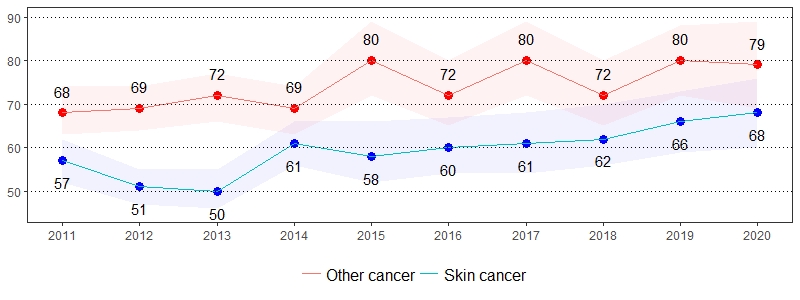
Color bands around estimates show 95% confidence intervals
Cardiovascular Disease, Pennsylvania Adults, Age 35+, 2020
| Ever Told Had Heart Attack, Heart Disease or Stroke* | Ever Told They Had a Heart Attack* | Ever Told They Had Angina or Heart Disease* | Ever Told They Had a Stroke* | |||||
|---|---|---|---|---|---|---|---|---|
| Demographics | % | CI | % | CI | % | CI | % | CI |
| All adults | 14 | 13-16 | 8 | 6-9 | 8 | 6-9 | 5 | 4-6 |
| Gender | ||||||||
| Male | 15 | 13-18 | 9 | 8-11 | 9 | 7-11 | 4 | 3-6 |
| Female | 13 | 11-15 | 6 | 5-8 | 7 | 5-9 | 5 | 3-6 |
| Age | ||||||||
| 35-44 | 4 | 2-7 | 3 | 1-6 | 2 | 1-5 | 1 | 0-4 |
| 45-54 | 6 | 4-8 | 3 | 2-5 | 2 | 1-4 | 2 | 1-4 |
| 55-64 | 11 | 9-14 | 5 | 4-7 | 6 | 4-8 | 3 | 2-4 |
| 65+ | 27 | 24-31 | 15 | 12-18 | 15 | 13-19 | 9 | 7-12 |
| Education | ||||||||
| < High school | 23 | 16-33 | 13 | 7-23 | 12 | 6-22 | 13 | 7-23 |
| High school | 17 | 14-19 | 9 | 7-11 | 9 | 7-11 | 5 | 4-7 |
| Some college | 15 | 12-18 | 7 | 5-9 | 7 | 5-9 | 4 | 3-6 |
| College degree | 8 | 6-10 | 4 | 3-5 | 5 | 4-7 | 1 | 1-1 |
| Household income | ||||||||
| < $15,000 | 27 | 18-39 | NSR | NSR | NSR | NSR | NSR | NSR |
| $15,000 to $24,999 | 25 | 20-31 | 13 | 9-18 | 14 | 10-20 | 10 | 7-15 |
| $25,000 to $49,999 | 17 | 14-22 | 8 | 6-11 | 8 | 6-11 | 7 | 5-10 |
| $50,000 to $74,999 | 15 | 11-20 | 9 | 6-13 | 8 | 5-12 | 3 | 1-5 |
| $75,000+ | 8 | 6-10 | 4 | 3-6 | 5 | 4-6 | 1 | 1-2 |
| Race | ||||||||
| White, non-Hispanic | 14 | 13-16 | 8 | 6-9 | 8 | 7-9 | 4 | 3-6 |
| Black, non-Hispanic | 13 | 9-18 | 6 | 4-10 | 7 | 4-11 | 4 | 2-8 |
| Hispanic | 14 | 7-25 | 8 | 3-18 | NSR | NSR | 7 | 2-17 |
*Excludes missing, don't know and refused
Note: If "NSR" is displayed, then the total response is less than 50 and/or the percentage prevalence is considered "not statistically reliable."
Cardiovascular Disease Prevalence per 1,000 Pennsylvania Population,
Pennsylvania Adults, Age 35+, 2011-2020
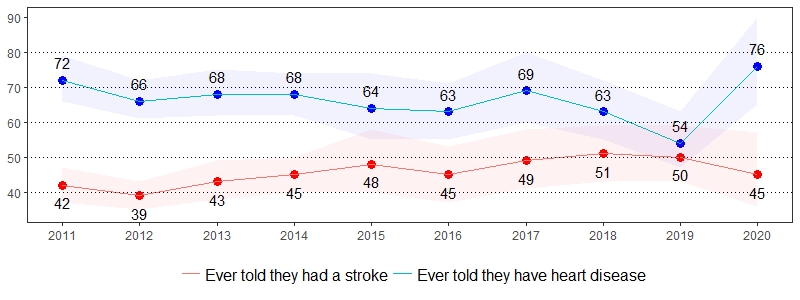
Color bands around estimates show 95% confidence intervals
Caregiver, Pennsylvania Adults, 2020
| Provided Regular Care/Assistance to Friend/Family Member Who Has Health Problem/Disability in the Past Month* | Averaged Up to 8 Hours/Week in the Past Month Providing Care/Assistance to Friend/Family Member Who Has Health Problem/Disability* | Averaged 40 Hours or More per Week in the Past Month Providing Care/Assistance to Friend/Family Member Who Has Health Problem/Disability* | ||||
|---|---|---|---|---|---|---|
| Demographics | % | CI | % | CI | % | CI |
| All adults | 18 | 17-20 | 52 | 47-57 | 22 | 18-26 |
| Gender | ||||||
| Male | 17 | 15-19 | 55 | 47-62 | 17 | 13-23 |
| Female | 20 | 17-22 | 50 | 44-57 | 26 | 20-32 |
| Age | ||||||
| 18-29 | 15 | 12-20 | NSR | NSR | NSR | NSR |
| 30-44 | 18 | 15-22 | 49 | 38-60 | 26 | 17-39 |
| 45-64 | 23 | 20-26 | 49 | 42-57 | 20 | 15-26 |
| 65+ | 14 | 12-17 | 56 | 46-65 | 23 | 16-32 |
| Education | ||||||
| < High school | 19 | 13-27 | NSR | NSR | NSR | NSR |
| High school | 18 | 16-21 | 50 | 41-59 | 17 | 12-24 |
| Some college | 19 | 16-22 | 52 | 43-61 | 24 | 17-32 |
| College degree | 17 | 15-20 | 63 | 55-69 | 19 | 14-26 |
| Household income | ||||||
| < $15,000 | 17 | 11-25 | NSR | NSR | NSR | NSR |
| $15,000 to $24,999 | 22 | 17-27 | 42 | 30-55 | 29 | 18-42 |
| $25,000 to $49,999 | 20 | 16-24 | 51 | 38-63 | 27 | 17-41 |
| $50,000 to $74,999 | 21 | 17-25 | 49 | 37-61 | 24 | 15-35 |
| $75,000+ | 15 | 13-18 | 59 | 50-67 | 14 | 9-21 |
| Race | ||||||
| White, non-Hispanic | 17 | 16-19 | 53 | 48-59 | 21 | 17-25 |
| Black, non-Hispanic | 16 | 12-21 | NSR | NSR | NSR | NSR |
| Hispanic | 34 | 25-45 | NSR | NSR | NSR | NSR |
*Excludes missing, don't know and refused
Note: If "NSR" is displayed, then the total response is less than 50 and/or the percentage prevalence is considered "not statistically reliable."
Provided Regular Care/Assistance to Friend/Family Member Who Has a Health Problem/Disability in the Past Month Prevalence per 1,000 Pennsylvania Population, Pennsylvania Adults, 2015-2020
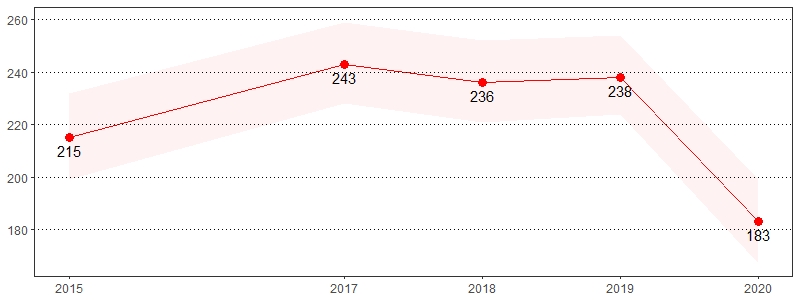
Color bands around estimates show 95% confidence intervals
Colorectal Cancer Screening, Pennsylvania Adults, Age 50+, 2020
| Ever Had a Colonoscopy* |
Had a Colonoscopy in the Past 10 Years* | Ever Had a Sigmoidoscopy* | Had a Sigmoidoscopy in the Past 10 Years* | |||||
|---|---|---|---|---|---|---|---|---|
| Demographics | % | CI | % | CI | % | CI | % | CI |
| All adults | 76 | 74-78 | 69 | 67-71 | 13 | 11-15 | 6 | 5-7 |
| Gender | ||||||||
| Male | 75 | 72-78 | 68 | 65-72 | 15 | 12-17 | 6 | 5-9 |
| Female | 77 | 74-80 | 70 | 67-73 | 12 | 10-14 | 5 | 4-7 |
| Age | ||||||||
| 50-64 | 71 | 68-74 | 68 | 65-71 | 8 | 6-10 | 4 | 3-5 |
| 65-74 | 84 | 80-87 | 77 | 73-81 | 16 | 13-20 | 6 | 4-9 |
| 75+ | 78 | 73-83 | 62 | 56-67 | 22 | 17-27 | 10 | 7-15 |
| Education | ||||||||
| < High school | 73 | 63-81 | 66 | 56-75 | 9 | 4-18 | 3 | 1-8 |
| High school | 75 | 71-78 | 66 | 62-70 | 13 | 10-16 | 7 | 5-9 |
| Some college | 75 | 70-79 | 68 | 63-72 | 12 | 9-15 | 6 | 4-9 |
| College degree | 81 | 78-84 | 75 | 72-78 | 15 | 13-18 | 5 | 4-7 |
| Household income | ||||||||
| < $15,000 | 68 | 57-77 | 60 | 49-71 | 9 | 5-14 | 6 | 4-12 |
| $15,000 to $24,999 | 73 | 67-79 | 64 | 57-71 | 13 | 9-18 | 8 | 5-13 |
| $25,000 to $49,999 | 75 | 70-80 | 67 | 61-72 | 13 | 10-18 | 5 | 3-9 |
| $50,000 to $74,999 | 79 | 73-83 | 70 | 64-76 | 13 | 9-18 | 3 | 1-6 |
| $75,000+ | 80 | 76-83 | 75 | 71-78 | 13 | 10-16 | 5 | 4-8 |
| Race | ||||||||
| White, non-Hispanic | 76 | 74-79 | 69 | 67-71 | 13 | 12-15 | 6 | 4-7 |
| Black, non-Hispanic | 79 | 70-85 | 74 | 65-81 | 11 | 7-18 | 8 | 4-14 |
| Hispanic | NSR | NSR | NSR | NSR | NSR | NSR | NSR | NSR |
*Excludes missing, don't know and refused
Note: If "NSR" is displayed, then the total response is less than 50 and/or the percentage prevalence is considered "not statistically reliable."
Note: No trend available. These questions were first asked in 2020.
Chronic Obstructive Pulmonary Disease (COPD), Pennsylvania Adults, 2020
| Ever Told They Have COPD, Emphysema or Chronic Bronchitis* | ||
|---|---|---|
| Demographics | % | CI |
| All adults | 7 | 6-8 |
| Gender | ||
| Male | 6 | 5-8 |
| Female | 8 | 7-10 |
| Age | ||
| 18-29 | 2 | 1-4 |
| 30-44 | 4 | 3-5 |
| 45-64 | 9 | 7-10 |
| 65+ | 13 | 11-16 |
| Education | ||
| < High school | 16 | 11-22 |
| High school | 9 | 7-10 |
| Some college | 7 | 6-9 |
| College degree | 3 | 2-3 |
| Household income | ||
| < $15,000 | 16 | 12-22 |
| $15,000 to $24,999 | 14 | 11-19 |
| $25,000 to $49,999 | 8 | 6-11 |
| $50,000 to $74,999 | 6 | 4-9 |
| $75,000+ | 3 | 3-5 |
| Race | ||
| White, non-Hispanic | 8 | 7-9 |
| Black, non-Hispanic | 6 | 4-9 |
| Hispanic | 6 | 3-12 |
*Excludes missing, don't know and refused
Chronic Obstructive Pulmonary Disease (COPD) Prevalence per 1,000 Pennsylvania Population, Pennsylvania Adults, 2011-2020
Color bands around estimates show 95% confidence intervals
Coronavirus (COVID-19) Pandemic, Pennsylvania Adults, 2020
| No Change in Primary Employment Due to COVID-19 Pandemic Since March 1st, 2020* |
Lost Insurance Due to COVID-19 Pandemic Since March 1st, 2020* | Someone in Household Was Told By a Doctor, Nurse, or Other Health Professional They Had COVID-19* | ||||
|---|---|---|---|---|---|---|
| Demographics | % | CI | % | CI | % | CI |
| All adults | 44 | 40-47 | 3 | 2-5 | 5 | 4-7 |
| Gender | ||||||
| Male | 44 | 39-49 | 4 | 3-7 | 5 | 3-7 |
| Female | 43 | 38-48 | 2 | 1-4 | 5 | 3-8 |
| Age | ||||||
| 18-29 | 38 | 31-46 | 3 | 2-7 | 8 | 4-16 |
| 30-44 | 48 | 41-54 | 4 | 3-7 | 7 | 4-11 |
| 45-64 | 45 | 40-51 | 4 | 2-8 | 5 | 3-8 |
| 65+ | 42 | 33-52 | 1 | 0-4 | 2 | 1-4 |
| Education | ||||||
| < High school | NSR | NSR | NSR | NSR | 5 | 2-13 |
| High school | 45 | 39-52 | 4 | 2-6 | 6 | 4-11 |
| Some college | 34 | 28-40 | 2 | 1-4 | 4 | 2-7 |
| College degree | 49 | 44-54 | 2 | 1-4 | 5 | 3-7 |
| Household income | ||||||
| < $15,000 | NSR | NSR | 5 | 2-13 | 2 | 0-7 |
| $15,000 to $24,999 | 38 | 28-50 | 7 | 3-14 | 4 | 2-7 |
| $25,000 to $49,999 | 40 | 32-49 | 4 | 2-7 | 3 | 1-6 |
| $50,000 to $74,999 | 41 | 32-51 | 1 | 0-3 | 4 | 2-7 |
| $75,000+ | 48 | 43-54 | 3 | 1-6 | 8 | 5-13 |
| Race | ||||||
| White, non-Hispanic | 43 | 39-47 | 3 | 2-4 | 5 | 3-7 |
| Black, non-Hispanic | 45 | 35-56 | 2 | 1-6 | 6 | 2-13 |
| Hispanic | NSR | NSR | NSR | NSR | 3 | 1-8 |
*Excludes missing, don't know and refused
Note: If "NSR" is displayed, then the total response is less than 50 and/or the percentage prevalence is considered "not statistically reliable."
Note: No trend available. These questions were first asked in 2020.
Depression, Pennsylvania Adults, 2020
| Ever Told They Have Some Form of Depressive Disorder* | ||
|---|---|---|
| Demographics | % | CI |
| All adults | 20 | 19-22 |
| Gender | ||
| Male | 14 | 12-16 |
| Female | 26 | 24-28 |
| Age | ||
| 18-29 | 24 | 20-28 |
| 30-44 | 25 | 22-28 |
| 45-64 | 19 | 17-22 |
| 65+ | 15 | 12-17 |
| Education | ||
| < High school | 28 | 22-35 |
| High school | 19 | 17-22 |
| Some college | 25 | 22-28 |
| College degree | 15 | 13-17 |
| Household income | ||
| < $15,000 | 43 | 35-51 |
| $15,000 to $24,999 | 24 | 20-29 |
| $25,000 to $49,999 | 24 | 20-28 |
| $50,000 to $74,999 | 18 | 15-22 |
| $75,000+ | 14 | 12-17 |
| Race | ||
| White, non-Hispanic | 20 | 18-22 |
| Black, non-Hispanic | 19 | 15-23 |
| Hispanic | 30 | 23-38 |
*Excludes missing, don't know and refused
Depression Prevalence per 1,000 Pennsylvania Population,
Pennsylvania Adults, 2011-2020
Color bands around estimates show 95% confidence intervals
Diabetes, Pennsylvania Adults, 2020
| Ever Told Have Diabetes* | Had Test for High Blood Sugar or Diabetes in the Past 3 Years* ** | Ever Told by Doctor or Other Health Professional They Have Pre-Diabetes or Borderline Diabetes* | ||||
|---|---|---|---|---|---|---|
| Demographics | % | CI | % | CI | % | CI |
| All adults | 11 | 10-13 | 54 | 51-56 | 11 | 10-13 |
| Gender | ||||||
| Male | 12 | 11-14 | 53 | 50-56 | 11 | 9-13 |
| Female | 10 | 9-12 | 54 | 51-57 | 12 | 10-14 |
| Age | ||||||
| 18-29 | 1 | 1-3 | 30 | 26-35 | 5 | 3-8 |
| 30-44 | 5 | 3-6 | 46 | 42-51 | 9 | 6-12 |
| 45-64 | 14 | 12-16 | 65 | 62-68 | 14 | 12-16 |
| 65+ | 23 | 20-26 | 67 | 63-70 | 16 | 14-19 |
| Education | ||||||
| < High school | 17 | 12-23 | 43 | 34-52 | 13 | 7-22 |
| High School | 14 | 12-16 | 53 | 49-56 | 11 | 9-13 |
| Some college | 11 | 9-13 | 53 | 49-57 | 11 | 9-14 |
| College degree | 8 | 6-9 | 58 | 55-61 | 11 | 9-13 |
| Household income | ||||||
| < $15,000 | 21 | 14-30 | 59 | 50-67 | 22 | 7-20 |
| $15,000 to $24,999 | 20 | 16-25 | 54 | 48-61 | 15 | 11-20 |
| $25,000 to $49,999 | 15 | 12-18 | 52 | 47-58 | 12 | 9-17 |
| $50,000 to $74,999 | 11 | 8-14 | 53 | 47-59 | 11 | 8-15 |
| $75,000+ | 7 | 5-8 | 55 | 51-58 | 10 | 8-12 |
| Race | ||||||
| White, non-Hispanic | 11 | 9-12 | 55 | 53-57 | 11 | 10-13 |
| Black, non-Hispanic | 19 | 15-24 | 57 | 51-64 | 17 | 13-23 |
| Hispanic | 10 | 6-14 | 45 | 34-55 | 6 | 3-14 |
*Excludes missing, don't know and refused
**Out of non-diabetic adults
Ever Told Have Diabetes Prevalence per 1,000 Pennsylvania Population,
Pennsylvania Adults, 2011-2020
Color bands around estimates show 95% confidence intervals
Drinking and Driving, Pennsylvania Adults, 2020
| Driven in the Past Month With Perhaps Too Much to Drink* | ||
|---|---|---|
| Demographics | % | CI |
| All adults | 2 | 2-3 |
| Gender | ||
| Male | 3 | 2-4 |
| Female | 2 | 1-3 |
| Age | ||
| 18-29 | 2 | 1-5 |
| 30-44 | 1 | 1-3 |
| 45-64 | 3 | 2-4 |
| 65+ | 2 | 1-4 |
| Education | ||
| < High school | 1 | 0-5 |
| High school | 2 | 1-4 |
| Some college | 2 | 1-4 |
| College degree | 2 | 1-4 |
| Household income | ||
| < $15,000 | 2 | 1-6 |
| $15,000 to $24,999 | 1 | 0-5 |
| $25,000 to $49,999 | 3 | 2-5 |
| $50,000 to $74,999 | 2 | 1-3 |
| $75,000+ | 3 | 2-4 |
| Race | ||
| White, non-Hispanic | 2 | 2-3 |
| Black, non-Hispanic | 3 | 1-8 |
| Hispanic | 1 | 0-5 |
*Excludes missing, don't know and refused
Drinking and Driving Prevalence per 1,000 Pennsylvania Population, Pennsylvania Adults, 2012-2020
Color bands around estimates show 95% confidence intervals
E-Cigarettes, Pennsylvania Adults, 2020
| Ever Used E-Cigarette or Other Electronic Vaping Product* | Currently Use E-Cigarette or Other Electronic Vaping Product Every Day* ** | Currently Use E-Cigarette or Other Electronic Vaping Product Some Days* ** | ||||
|---|---|---|---|---|---|---|
| Demographics | % | CI | % | CI | % | CI |
| All adults | 22 | 20-23 | 10 | 8-12 | 15 | 12-18 |
| Gender | ||||||
| Male | 25 | 23-28 | 10 | 7-14 | 16 | 12-21 |
| Female | 18 | 16-20 | 9 | 6-13 | 13 | 9-18 |
| Age | ||||||
| 18-29 | 43 | 37-48 | 14 | 10-20 | 18 | 13-25 |
| 30-44 | 34 | 30-38 | 7 | 4-11 | 14 | 10-21 |
| 45-64 | 14 | 12-16 | 8 | 5-14 | 12 | 8-18 |
| 65+ | 6 | 4-8 | 6 | 2-16 | NSR | NSR |
| Education | ||||||
| < High school | 24 | 17-32 | NSR | NSR | NSR | NSR |
| High school | 22 | 19-25 | 9 | 6-13 | 13 | 9-19 |
| Some college | 27 | 23-30 | 14 | 9-20 | 15 | 10-20 |
| College degree | 15 | 13-18 | 5 | 2-9 | 14 | 9-20 |
| Household income | ||||||
| < $15,000 | 25 | 18-33 | NSR | NSR | NSR | NSR |
| $15,000 to $24,999 | 19 | 15-24 | 12 | 6-23 | 10 | 5-17 |
| $25,000 to $49,999 | 27 | 23-31 | 11 | 7-18 | 11 | 6-18 |
| $50,000 to $74,999 | 26 | 22-31 | 11 | 6-19 | 23 | 14-34 |
| $75,000+ | 19 | 16-22 | 7 | 4-12 | 12 | 8-18 |
| Race | ||||||
| White, non-Hispanic | 22 | 20-24 | 11 | 8-14 | 14 | 11-18 |
| Black, non-Hispanic | 19 | 14-24 | 2 | 0-7 | 7 | 2-17 |
| Hispanic | 28 | 20-37 | NSR | NSR | NSR | NSR |
*Excludes missing, don't know and refused
**Out of adults who ever used e-cigarettes or other electronic vaping products
Note: If "NSR" is displayed, then the total response is less than 50 and/or the percentage prevalence is considered "not statistically reliable."
Ever Used E-Cigarette or Other Electronic Vaping Product
Prevalence per 1,000 Pennsylvania Population, Pennsylvania Adults, 2016-2020
Color bands around estimates show 95% confidence intervals
Environmenal Health, Pennsylvania Adults, 2020
| Had a New or Continuing Illness or Symptom You Feel Was Caused by Environmental Contamination in the Past Year* | Main Source of Drinking Water is a Private Water Well* | |||
|---|---|---|---|---|
| Demographics | % | CI | % | CI |
| All adults | 3 | 2-3 | 26 | 24-28 |
| Gender | ||||
| Male | 2 | 2-3 | 25 | 23-28 |
| Female | 3 | 2-4 | 26 | 23-29 |
| Age | ||||
| 18-29 | 2 | 1-4 | 27 | 22-33 |
| 30-44 | 4 | 2-6 | 24 | 20-28 |
| 45-64 | 2 | 1-3 | 27 | 24-30 |
| 65+ | 3 | 2-4 | 24 | 21-28 |
| Education | ||||
| < High school | 2 | 0-6 | 29 | 21-38 |
| High school | 2 | 1-3 | 30 | 27-34 |
| Some college | 4 | 3-5 | 26 | 23-30 |
| College degree | 3 | 2-4 | 18 | 16-20 |
| Household income | ||||
| < $15,000 | 7 | 4-13 | 18 | 12-26 |
| $15,000 to $24,999 | 3 | 2-5 | 27 | 22-33 |
| $25,000 to $49,999 | 3 | 2-4 | 24 | 21-29 |
| $50,000 to $74,999 | 3 | 1-5 | 31 | 26-36 |
| $75,000+ | 2 | 1-3 | 25 | 22-28 |
| Race | ||||
| White, non-Hispanic | 2 | 2-3 | 29 | 27-31 |
| Black, non-Hispanic | 2 | 1-3 | 4 | 2-7 |
| Hispanic | 5 | 3-10 | 23 | 14-36 |
*Excludes missing, don't know and refused
Note: No trend available. These questions were first asked in 2020.
Exercise, Pennsylvania Adults, 2020
| Participated in No Physical Activity in the Past Month* ** | ||
|---|---|---|
| Demographics | % | CI |
| All adults | 24 | 23-26 |
| Gender | ||
| Male | 21 | 19-23 |
| Female | 28 | 25-30 |
| Age | ||
| 18-29 | 16 | 13-20 |
| 30-44 | 20 | 17-24 |
| 45-64 | 25 | 22-27 |
| 65+ | 34 | 31-38 |
| Education | ||
| < High school | 45 | 37-53 |
| High School | 31 | 28-34 |
| Some college | 21 | 19-24 |
| College degree | 12 | 11-14 |
| Household income | ||
| < $15,000 | 45 | 37-53 |
| $15,000 to $24,999 | 40 | 35-45 |
| $25,000 to $49,999 | 26 | 23-30 |
| $50,000 to $74,999 | 19 | 16-23 |
| $75,000+ | 15 | 12-17 |
| Race | ||
| White, non-Hispanic | 23 | 21-25 |
| Black, non-Hispanic | 30 | 25-35 |
| Hispanic | 34 | 27-41 |
*Excludes missing, don't know and refused
**Odd years of survey include the following interviewer instruction: If respondent does not have a "regular job duty" or is retired, they may count the physical activity or exercise they spend the most time doing in a regular month.
Exercise Prevalence per 1,000 Pennsylvania Population,
Pennsylvania Adults, 2011-2020
Color bands around estimates show 95% confidence intervals
Falls, Pennsylvania Adults, Age 45+, 2020
| Have Fallen in the Past 12 Months* | Fall Caused an Injury in the Past 12 Months* ** |
|||
|---|---|---|---|---|
| Demographics | % | CI | % | CI |
| All adults | 25 | 23-27 | 10 | 9-12 |
| Gender | ||||
| Male | 23 | 20-26 | 8 | 6-10 |
| Female | 27 | 25-30 | 13 | 10-15 |
| Age | ||||
| 45-64 | 23 | 21-26 | 10 | 8-12 |
| 65+ | 28 | 25-31 | 11 | 8-14 |
| Education | ||||
| < High school | 39 | 30-49 | 20 | 13-31 |
| High school | 25 | 21-28 | 9 | 7-12 |
| Some college | 28 | 24-32 | 12 | 9-16 |
| College degree | 20 | 18-23 | 8 | 6-10 |
| Household income | ||||
| < $15,000 | 43 | 34-53 | 25 | 17-36 |
| $15,000 to $24,999 | 38 | 31-45 | 16 | 11-22 |
| $25,000 to $49,999 | 26 | 22-31 | 11 | 8-15 |
| $50,000 to $74,999 | 20 | 16-26 | 5 | 3-9 |
| $75,000+ | 19 | 16-23 | 8 | 6-11 |
| Race | ||||
| White, non-Hispanic | 26 | 23-28 | 10 | 9-12 |
| Black, non-Hispanic | 23 | 17-30 | 11 | 7-16 |
| Hispanic | 27 | 17-41 | NSR | NSR |
*Excludes missing, don't know and refused
**A fall that limited regular activities for at least 1 day or required a trip to go see a doctor
Note: If "NSR" is displayed, then the total response is less than 50 and/or the percentage prevalence is considered "not statistically reliable."
Have Fallen in the Past 12 Months Prevalence per 1,000 Pennsylvania Population,
Pennsylvania Adults, Age 45+, 2012-2020
Color bands around estimates show 95% confidence intervals
Gambling, Pennsylvania Adults, 2020
| Gambled in the 12 Months* | Gambled Online in the Past 12 Months* ** |
Gambled at a Casino or Racino in the Past 12 Months* ** | ||||
|---|---|---|---|---|---|---|
| Demographics | % | CI | % | CI | % | CI |
| All adults | 28 | 27-30 | 14 | 11-16 | 42 | 39-46 |
| Gender | ||||||
| Male | 34 | 31-36 | 18 | 14-21 | 40 | 35-44 |
| Female | 23 | 21-26 | 9 | 5-13 | 46 | 40-51 |
| Age | ||||||
| 18-29 | 23 | 19-28 | 33 | 23-44 | 40 | 30-50 |
| 30-44 | 33 | 29-38 | 16 | 12-22 | 48 | 41-55 |
| 45-64 | 31 | 28-34 | 10 | 7-14 | 43 | 37-49 |
| 65+ | 25 | 22-29 | 4 | 2-7 | 36 | 29-43 |
| Education | ||||||
| < High school | 19 | 13-27 | NSR | NSR | NSR | NSR |
| High School | 29 | 26-32 | 12 | 8-16 | 39 | 33-45 |
| Some college | 30 | 27-34 | 15 | 10-21 | 45 | 39-52 |
| College degree | 29 | 26-32 | 16 | 13-21 | 45 | 40-50 |
| Household income | ||||||
| < $15,000 | 20 | 14-27 | NSR | NSR | NSR | NSR |
| $15,000 to $24,999 | 24 | 19-29 | NSR | NSR | NSR | NSR |
| $25,000 to $49,999 | 33 | 28-37 | 12 | 7-19 | 35 | 28-42 |
| $50,000 to $74,999 | 29 | 24-33 | 13 | 8-21 | 47 | 38-56 |
| $75,000+ | 34 | 31-38 | 18 | 14-22 | 47 | 41-52 |
| Race | ||||||
| White, non-Hispanic | 30 | 28-32 | 13 | 11-16 | 42 | 38-46 |
| Black, non-Hispanic | 22 | 17-28 | 10 | 4-21 | 51 | 38-64 |
| Hispanic | 18 | 12-26 | NSR | NSR | NSR | NSR |
*Excludes missing, don't know and refused
**Out of those who gambled in the past 12 months
Note: If "NSR" is displayed, then the total response is less than 50 and/or the percentage prevalence is considered "not statistically reliable."
Note: No trend available. These questions were first asked in 2020.
General Health, Pennsylvania Adults, 2020
| Fair or Poor General Health* | ||
|---|---|---|
| Demographics | % | CI |
| All Adults | 14 | 13-15 |
| Gender | ||
| Male | 13 | 11-14 |
| Female | 16 | 14-18 |
| Age | ||
| 18-29 | 7 | 5-9 |
| 30-44 | 11 | 8-13 |
| 45-64 | 15 | 13-17 |
| 65+ | 23 | 20-26 |
| Education | ||
| < High school | 27 | 20-34 |
| High school | 18 | 16-20 |
| Some college | 14 | 12-17 |
| College degree | 5 | 5-7 |
| Household income | ||
| < $15,000 | 39 | 31-48 |
| $15,000 to $24,999 | 30 | 26-35 |
| $25,000 to $49,999 | 16 | 13-19 |
| $50,000 to $74,999 | 10 | 7-13 |
| $75,000+ | 6 | 4-7 |
| Race | ||
| White, non-Hispanic | 13 | 12-15 |
| Black, non-Hispanic | 21 | 17-25 |
| Hispanic | 16 | 11-23 |
*Excludes missing, don't know and refused
Fair or Poor General Health Prevalence per 1,000 Pennsylvania Population,
Pennsylvania Adults, 2011-2020
Color bands around estimates show 95% confidence intervals
Health Care Access, Pennsylvania Adults, 2020
| Does Not Have a Personal Health Care Provider* | Couldn't Afford to Receive Care in the Past Year* |
Visited a Doctor for a Routine Checkup in the Past 2 Years* | ||||
|---|---|---|---|---|---|---|
| Demographics | % | CI | % | CI | % | CI |
| All adults | 15 | 14-16 | 8 | 7-9 | 91 | 90-92 |
| Gender | ||||||
| Male | 20 | 18-22 | 8 | 6-9 | 88 | 87-90 |
| Female | 11 | 9-12 | 8 | 7-10 | 94 | 93-95 |
| Age | ||||||
| 18-29 | 28 | 24-32 | 10 | 7-13 | 88 | 85-90 |
| 30-44 | 23 | 20-27 | 11 | 8-13 | 85 | 83-88 |
| 45-64 | 9 | 7-10 | 8 | 6-9 | 92 | 90-94 |
| 65+ | 5 | 4-6 | 4 | 3-6 | 98 | 97-98 |
| Education | ||||||
| < High school | 19 | 14-26 | 8 | 5-13 | 89 | 83-93 |
| High school | 16 | 14-18 | 9 | 7-11 | 91 | 90-93 |
| Some college | 15 | 13-17 | 8 | 7-10 | 92 | 90-94 |
| College degree | 13 | 11-14 | 6 | 5-8 | 91 | 89-92 |
| Household income | ||||||
| < $15,000 | 17 | 12-22 | 11 | 7-15 | 92 | 87-95 |
| $15,000 to $24,999 | 15 | 12-19 | 12 | 9-15 | 92 | 89-94 |
| $25,000 to $49,999 | 13 | 11-16 | 12 | 10-15 | 90 | 88-93 |
| $50,000 to $74,999 | 16 | 13-19 | 10 | 7-14 | 87 | 84-90 |
| $75,000+ | 13 | 11-16 | 4 | 3-5 | 92 | 90-93 |
| Race | ||||||
| White, non-Hispanic | 13 | 12-15 | 7 | 6-8 | 91 | 90-92 |
| Black, non-Hispanic | 14 | 11-18 | 12 | 8-17 | 94 | 91-96 |
| Hispanic | 23 | 17-31 | 13 | 9-19 | 94 | 91-96 |
*Excludes missing, don't know and refused
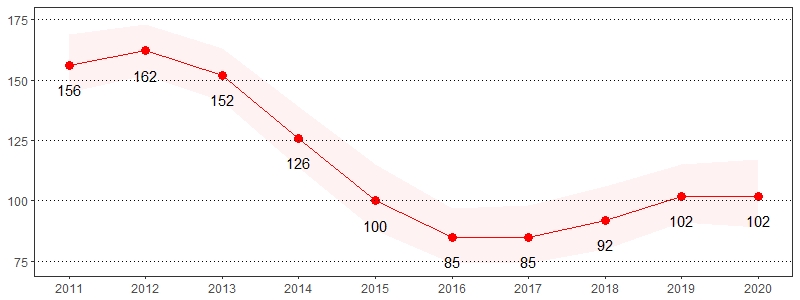
Health Care Access Prevalence per 1,000 Pennsylvania Population,
Pennsylvania Adults, 2011-2020
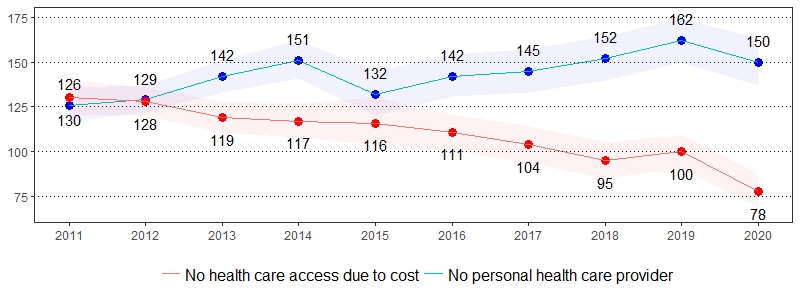
Color bands around estimates show 95% confidence intervals
Health Care Coverage, Pennsylvania Adults, Age 18-64, 2020
| No Health Insurance, Age 18-64* | ||
|---|---|---|
| Demographics | % | CI |
| All adults | 10 | 9-12 |
| Gender | ||
| Male | 11 | 10-14 |
| Female | 9 | 7-11 |
| Age | ||
| 18-29 | 13 | 10-17 |
| 30-44 | 12 | 10-15 |
| 45-64 | 7 | 5-9 |
| Education | ||
| < High school | 25 | 18-34 |
| High school | 14 | 11-17 |
| Some college | 7 | 6-9 |
| College degree | 5 | 3-6 |
| Household income | ||
| < $15,000 | 9 | 5-15 |
| $15,000 to $24,999 | 20 | 15-26 |
| $25,000 to $49,999 | 18 | 14-22 |
| $50,000 to $74,999 | 10 | 6-15 |
| $75,000+ | 4 | 3-6 |
| Race | ||
| White, non-Hispanic | 8 | 7-10 |
| Black, non-Hispanic | 14 | 10-19 |
| Hispanic | 19 | 12-27 |
*Excludes missing, don't know and refused
Health Care Coverage Prevalence per 1,000 Pennsylvania Population,
Pennsylvania Adults, Age 18-64, 2011-2020
Color bands around estimates show 95% confidence intervals
Health Literacy, Pennsylvania Adults, 2020
| Somewhat or very difficult to get needed advice or information about health or medical topics* | Somewhat or very difficult to understand information from doctors, nurses or other health professionals* | Somewhat or very difficult to understand written health information* | ||||
|---|---|---|---|---|---|---|
| Demographics | % | CI | % | CI | % | CI |
| All adults | 5 | 4-6 | 6 | 5-7 | 7 | 6-8 |
| Gender | ||||||
| Male | 5 | 4-6 | 7 | 6-8 | 7 | 6-9 |
| Female | 5 | 4-6 | 5 | 4-6 | 6 | 5-8 |
| Age | ||||||
| 18-29 | 6 | 4-8 | 5 | 3-7 | 6 | 4-9 |
| 30-44 | 4 | 2-6 | 6 | 5-9 | 7 | 5-10 |
| 45-64 | 5 | 4-6 | 7 | 5-8 | 5 | 4-7 |
| 65+ | 5 | 3-6 | 6 | 4-8 | 8 | 6-11 |
| Education | ||||||
| < High school | 3 | 1-7 | 13 | 9-19 | 14 | 10-20 |
| High School | 5 | 4-7 | 8 | 6-9 | 8 | 6-10 |
| Some college | 6 | 5-9 | 4 | 3-5 | 7 | 5-9 |
| College degree | 3 | 2-4 | 3 | 2-4 | 3 | 2-3 |
| Household income | ||||||
| < $15,000 | 9 | 5-14 | 10 | 6-15 | 17 | 12-24 |
| $15,000 to $24,999 | 9 | 6-13 | 12 | 9-17 | 10 | 7-15 |
| $25,000 to $49,999 | 5 | 3-8 | 7 | 5-10 | 7 | 5-9 |
| $50,000 to $74,999 | 2 | 1-4 | 3 | 2-4 | 6 | 4-10 |
| $75,000+ | 4 | 2-5 | 3 | 2-4 | 3 | 2-4 |
| Race | ||||||
| White, non-Hispanic | 4 | 3-5 | 5 | 5-7 | 6 | 5-7 |
| Black, non-Hispanic | 8 | 5-12 | 8 | 6-12 | 13 | 9-18 |
| Hispanic | 8 | 4-14 | 8 | 4-13 | 4 | 2-10 |
*Excludes missing, don't know and refused
Somewhat or Very Difficult to Get Needed Advice or Information About Health or Medical
Topics Prevalence per 1,000 Pennsylvania Population, Pennsylvania Adults, 2016-2020
Color bands around estimates show 95% confidence intervals
Hearing and Vision Problem, Pennsylvania Adults, 2020
| Deaf or Serious Difficulty Hearing* | Blind or Serious Difficulty Seeing, Even With Glasses* |
|||
|---|---|---|---|---|
| Demographics | % | CI | % | CI |
| All adults | 7 | 6-8 | 4 | 3-5 |
| Gender | ||||
| Male | 8 | 7-10 | 4 | 3-5 |
| Female | 6 | 5-7 | 4 | 3-5 |
| Age | ||||
| 18-29 | 1 | 1-3 | 2 | 1-3 |
| 30-44 | 3 | 2-5 | 2 | 2-4 |
| 45-64 | 7 | 5-8 | 4 | 3-6 |
| 65+ | 16 | 14-19 | 6 | 5-8 |
| Education | ||||
| < High school | 11 | 8-17 | 9 | 6-13 |
| High school | 9 | 7-11 | 5 | 4-6 |
| Some college | 6 | 5-8 | 3 | 3-5 |
| College degree | 4 | 4-5 | 2 | 1-2 |
| Household income | ||||
| < $15,000 | 12 | 7-18 | 12 | 8-18 |
| $15,000 to $24,999 | 14 | 11-18 | 9 | 6-12 |
| $25,000 to $49,999 | 8 | 6-10 | 4 | 3-6 |
| $50,000 to $74,999 | 7 | 5-10 | 2 | 1-4 |
| $75,000+ | 4 | 3-5 | 1 | 1-2 |
| Race | ||||
| White, non-Hispanic | 7 | 6-9 | 3 | 3-4 |
| Black, non-Hispanic | 6 | 4-9 | 7 | 5-10 |
| Hispanic | 6 | 3-10 | 7 | 4-12 |
*Excludes missing, don't know and refused
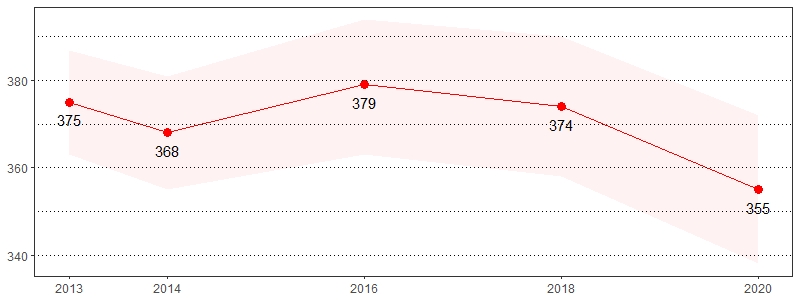
Vision Problem Prevalence per 1,000 Pennsylvania Population,
Pennsylvania Adults, 2013-2020
Color bands around estimates show 95% confidence intervals
HIV/AIDS, Pennsylvania Adults, Age 18-64, 2020
| Ever Tested for HIV, Except Blood Donation* |
Tested for HIV in the Past Year, Except Blood Donation* | HIV Situation Applies* ** | ||||
|---|---|---|---|---|---|---|
| Demographics | % | CI | % | CI | % | CI |
| All adults | 41 | 39-44 | 10 | 8-11 | 7 | 6-8 |
| Gender | ||||||
| Male | 39 | 36-42 | 9 | 7-12 | 8 | 7-10 |
| Female | 44 | 41-48 | 10 | 8-12 | 6 | 5-8 |
| Age | ||||||
| 18-29 | 30 | 26-35 | 12 | 9-16 | 14 | 11-18 |
| 30-44 | 55 | 51-59 | 14 | 11-18 | 8 | 6-10 |
| 45-64 | 38 | 35-41 | 4 | 3-6 | 2 | 2-4 |
| Education | ||||||
| < High school | 44 | 35-54 | 6 | 3-12 | 8 | 4-15 |
| High school | 37 | 33-41 | 9 | 6-13 | 7 | 5-10 |
| Some college | 45 | 40-49 | 11 | 9-15 | 8 | 6-11 |
| College degree | 42 | 39-45 | 9 | 8-12 | 6 | 5-7 |
| Household income | ||||||
| < $15,000 | 55 | 45-64 | 17 | 11-26 | 14 | 9-22 |
| $15,000 to $24,999 | 53 | 46-61 | 19 | 13-27 | 6 | 4-9 |
| $25,000 to $49,999 | 49 | 43-54 | 12 | 9-17 | 11 | 7-15 |
| $50,000 to $74,999 | 35 | 29-41 | 7 | 4-14 | 9 | 6-14 |
| $75,000+ | 37 | 34-41 | 6 | 5-8 | 5 | 3-6 |
| Race | ||||||
| White, non-Hispanic | 36 | 34-38 | 6 | 5-7 | 6 | 5-8 |
| Black, non-Hispanic | 74 | 68-80 | 33 | 25-41 | 13 | 8-20 |
| Hispanic | 51 | 42-59 | 18 | 12-26 | 10 | 5-17 |
*Excludes missing, don't know and refused
**Defined as having injected unprescribed drugs, having been treated for a sexually transmitted or venereal disease, having given or received money or drugs in exchange for sex, had anal sex without a condom or had four or more sex partners in the past year
Ever Tested for HIV, Except Blood Donation Prevalence per 1,000 Pennsylvania Population,
Pennsylvania Adults, Age 18-64, 2011-2020
Color bands around estimates show 95% confidence intervals
Human Papilloma Virus (HPV) Test, Pennsylvania Women, 2020
| Ever Had a HPV Test* | Had a HPV Test in the Past Year* | |||
|---|---|---|---|---|
| Demographics | % | CI | % | CI |
| Gender | ||||
| Female | 47 | 44-50 | 37 | 33-41 |
| Age | ||||
| 18-29 | 39 | 32-46 | 55 | 44-66 |
| 30-44 | 76 | 70-81 | 35 | 28-43 |
| 45-64 | 52 | 47-57 | 33 | 27-40 |
| 65+ | 21 | 17-25 | 27 | 18-37 |
| Education | ||||
| < High school | 36 | 24-49 | NSR | NSR |
| High school | 38 | 33-43 | 42 | 33-51 |
| Some college | 47 | 41-53 | 37 | 29-46 |
| College degree | 60 | 56-64 | 33 | 28-39 |
| Household income | ||||
| < $15,000 | 36 | 25-48 | NSR | NSR |
| $15,000 to $24,999 | 44 | 36-53 | 36 | 25-48 |
| $25,000 to $49,999 | 47 | 40-54 | 40 | 31-50 |
| $50,000 to $74,999 | 50 | 42-58 | 35 | 26-47 |
| $75,000+ | 54 | 48-60 | 38 | 31-46 |
| Race | ||||
| White, non-Hispanic | 47 | 43-50 | 34 | 30-39 |
| Black, non-Hispanic | 53 | 44-61 | 45 | 34-56 |
| Hispanic | 51 | 39-63 | NSR | NSR |
*Excludes missing, don't know and refused
Note: If "NSR" is displayed, then the total response is less than 50 and/or the percentage prevalence is considered "not statistically reliable."
Human Papilloma Virus (HPV) Prevalence per 1,000 Pennsylvania Population,
Pennsylvania Women, 2014-2020
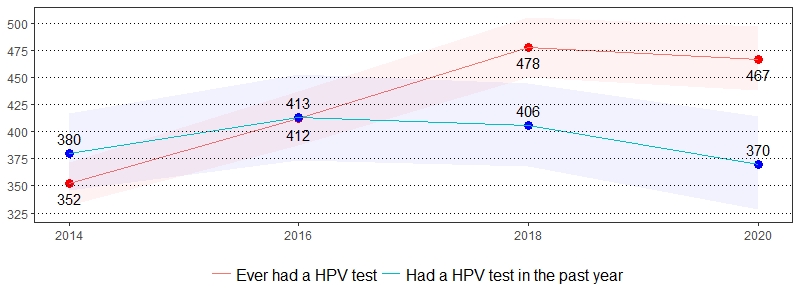
Color bands around estimates show 95% confidence intervals
Immunization, Pennsylvania Adults, 2020
| Had Flu Shot or Flu Vaccine Sprayed in Nose in the Past Year* | Ever Had Pneumonia Vaccination, Age 65+* | Ever Had Shingles or Zoster Vaccination, Age 60+* |
||||
|---|---|---|---|---|---|---|
| Demographics | % | CI | % | CI | % | CI |
| All adults | 50 | 48-52 | 71 | 68-75 | 42 | 39-45 |
| Gender | ||||||
| Male | 45 | 42-48 | 67 | 62-71 | 38 | 33-42 |
| Female | 55 | 52-58 | 75 | 71-79 | 47 | 42-51 |
| Age | ||||||
| 18-29 | 41 | 36-46 | NSR | NSR | NSR | NSR |
| 30-44 | 39 | 36-42 | NSR | NSR | NSR | NSR |
| 45-64 | 52 | 49-56 | NSR | NSR | NSR | NSR |
| 60+ | NSR | NSR | NSR | NSR | 42 | 39-45 |
| 65+ | 67 | 63-70 | 71 | 68-75 | NSR | NSR |
| Education | ||||||
| < High school | 38 | 30-46 | 67 | 53-78 | NSR | NSR |
| High school | 46 | 43-50 | 72 | 66-76 | 40 | 35-45 |
| Some college | 51 | 47-54 | 71 | 64-77 | 43 | 37-49 |
| College degree | 58 | 56-61 | 74 | 68-79 | 52 | 47-57 |
| Household income | ||||||
| < $15,000 | 44 | 36-53 | NSR | NSR | NSR | NSR |
| $15,000 to $24,999 | 48 | 42-54 | 71 | 62-79 | 31 | 24-39 |
| $25,000 to $49,999 | 49 | 45-53 | 75 | 68-80 | 38 | 32-45 |
| $50,000 to $74,999 | 45 | 40-50 | 74 | 65-82 | 49 | 41-58 |
| $75,000+ | 55 | 52-58 | 70 | 63-76 | 50 | 44-56 |
| Race | ||||||
| White, non-Hispanic | 52 | 50-54 | 74 | 70-77 | 45 | 42-48 |
| Black, non-Hispanic | 44 | 39-50 | 53 | 39-66 | 24 | 17-34 |
| Hispanic | 37 | 30-45 | NSR | NSR | NSR | NSR |
*Excludes missing, don't know and refused
Note: If "NSR" is displayed, then the total response is less than 50 and/or the percentage prevalence is considered "not statistically reliable."
Immunization Prevalence per 1,000 Pennsylvania Population,
Pennsylvania Adults, 2011-2020
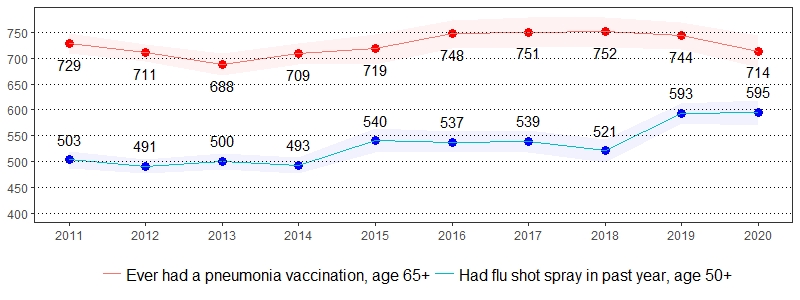
Color bands around estimates show 95% confidence intervals
Inadequate Sleep, Pennsylvania Adults, 2020
| Average 6 or Fewer Hours of Sleep in a 24-Hour Period* |
Average 7-9 Hours of Sleep in a 24-Hour Period* |
|||
|---|---|---|---|---|
| Demographics | % | CI | % | CI |
| All adults | 35 | 34-37 | 60 | 59-62 |
| Gender | ||||
| Male | 36 | 33-38 | 61 | 59-64 |
| Female | 35 | 33-38 | 60 | 57-62 |
| Age | ||||
| 18-29 | 36 | 31-40 | 59 | 55-64 |
| 30-44 | 43 | 39-47 | 55 | 51-58 |
| 45-64 | 37 | 34-40 | 60 | 57-63 |
| 65+ | 26 | 23-29 | 67 | 64-71 |
| Education | ||||
| < High school | 42 | 35-50 | 45 | 38-53 |
| High school | 38 | 35-41 | 57 | 54-61 |
| Some college | 37 | 34-40 | 60 | 56-63 |
| College degree | 29 | 27-32 | 69 | 67-71 |
| Household income | ||||
| < $15,000 | 43 | 35-51 | 48 | 40-56 |
| $15,000 to $24,999 | 35 | 30-41 | 54 | 49-59 |
| $25,000 to $49,999 | 41 | 37-46 | 54 | 49-58 |
| $50,000 to $74,999 | 35 | 30-40 | 63 | 58-68 |
| $75,000+ | 33 | 31-36 | 65 | 62-67 |
| Race | ||||
| White, non-Hispanic | 34 | 32-36 | 62 | 60-64 |
| Black, non-Hispanic | 45 | 39-51 | 50 | 44-55 |
| Hispanic | 40 | 32-48 | 56 | 48-64 |
*Excludes missing, don't know and refused
Average 6 or Fewer Hours of Sleep in a 24-Hour Period Prevalence per 1,000 Pennsylvania Population, Pennsylvania Adults, 2013-2020
Color bands around estimates show 95% confidence intervals
Kidney Disease, Pennsylvania Adults, 2020
| Ever Told Have Kidney Disease* | ||
|---|---|---|
| Demographics | % | CI |
| All adults | 3 | 3-4 |
| Gender | ||
| Male | 2 | 2-3 |
| Female | 4 | 3-5 |
| Age | ||
| 18-29 | 0 | 0-0 |
| 30-44 | 1 | 1-2 |
| 45-64 | 3 | 2-4 |
| 65+ | 9 | 7-12 |
| Education | ||
| < High school | 8 | 4-15 |
| High school | 3 | 2-4 |
| Some college | 3 | 2-5 |
| College degree | 2 | 1-3 |
| Household income | ||
| < $15,000 | 11 | 5-22 |
| $15,000 to $24,999 | 7 | 5-11 |
| $25,000 to $49,999 | 3 | 2-5 |
| $50,000 to $74,999 | 2 | 1-3 |
| $75,000+ | 2 | 1-2 |
| Race | ||
| White, non-Hispanic | 4 | 3-5 |
| Black, non-Hispanic | 2 | 1-4 |
| Hispanic | 2 | 1-6 |
*Excludes missing, don't know and refused
Kidney Disease Prevalence per 1,000 Pennsylvania Population,
Pennsylvania Adults, 2011-2020
Color bands around estimates show 95% confidence intervals
Occupational Health, Pennsylvania Adults, 2020
| Received Medical Advice After Being Injured Seriously Enough Performing Their Job in the Past Year* |
||
|---|---|---|
| Demographics | % | CI |
| All adults | 5 | 4-6 |
| Gender | ||
| Male | 6 | 4-7 |
| Female | 4 | 3-5 |
| Age | ||
| 18-29 | 6 | 4-10 |
| 30-44 | 5 | 3-7 |
| 45-64 | 4 | 3-6 |
| 65+ | 2 | 1-6 |
| Education | ||
| < High school | 3 | 2-13 |
| High school | 7 | 5-10 |
| Some college | 4 | 3-7 |
| College degree | 2 | 2-3 |
| Household income | ||
| < $15,000 | NSR | NSR |
| $15,000 to $24,999 | 3 | 1-7 |
| $25,000 to $49,999 | 6 | 4-10 |
| $50,000 to $74,999 | 4 | 2-7 |
| $75,000+ | 3 | 2-5 |
| Race | ||
| White, non-Hispanic | 5 | 4-6 |
| Black, non-Hispanic | 5 | 2-9 |
| Hispanic | NSR | NSR |
*Excludes missing, don't know and refused
Note: If "NSR" is displayed, then the total response is less than 50 and/or the percentage prevalence is considered "not statistically reliable."
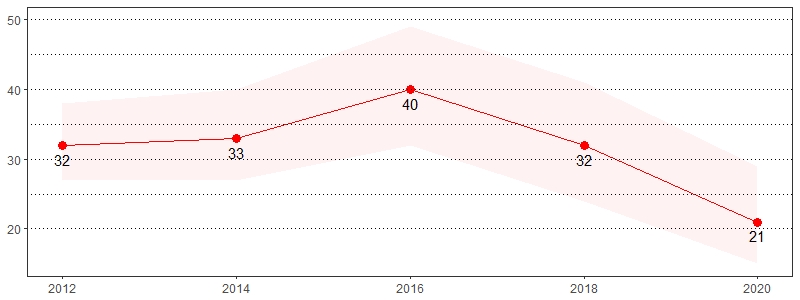
Received Medical Advice After Being Injured Seriously Enough Performing Their Job in the Past Year
Prevalence per 1,000 Pennsylvania Population, Pennsylvania Adults, 2018-2020
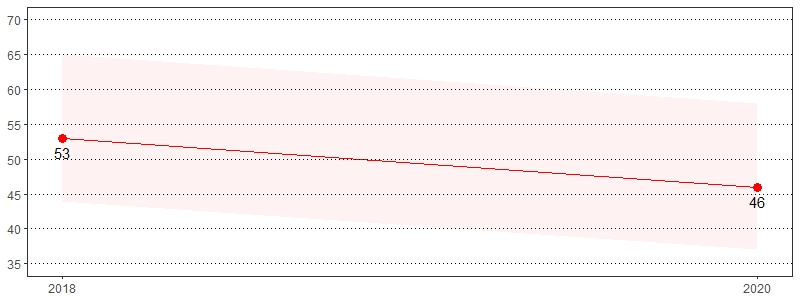
Color bands around estimates show 95% confidence intervals
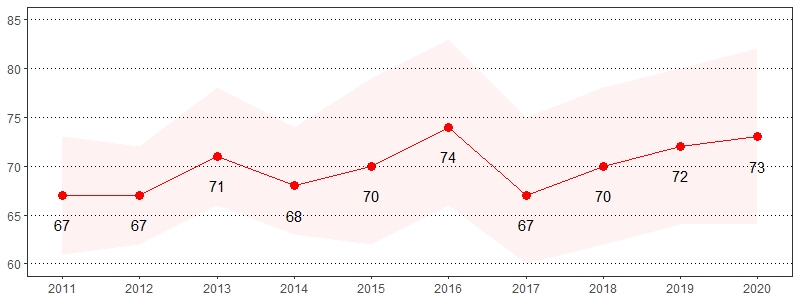
Oral Health, Pennsylvania Adults, 2020
| Visited a Dentist in the Past Year* | Had Any Permanent Teeth Removed* ** | Had Teeth Cleaned by a Dentist or Dental Hygienist in the Past Year* | ||||
|---|---|---|---|---|---|---|
| Demographics | % | CI | % | CI | % | CI |
| All adults | 68 | 66-70 | 42 | 41-44 | 70 | 68-72 |
| Gender | ||||||
| Male | 65 | 62-67 | 43 | 41-46 | 66 | 64-69 |
| Female | 71 | 69-74 | 42 | 39-44 | 73 | 70-75 |
| Age | ||||||
| 18-29 | 69 | 64-73 | 12 | 9-16 | 71 | 66-75 |
| 30-44 | 63 | 59-67 | 31 | 27-34 | 62 | 58-66 |
| 45-64 | 72 | 69-74 | 50 | 47-52 | 72 | 69-75 |
| 65+ | 68 | 64-71 | 70 | 67-73 | 73 | 69-77 |
| Education | ||||||
| < High school | 47 | 39-55 | 60 | 52-67 | 51 | 41-60 |
| High school | 64 | 61-67 | 51 | 48-54 | 65 | 62-68 |
| Some college | 70 | 67-73 | 41 | 38-45 | 70 | 67-74 |
| College degree | 79 | 77-81 | 28 | 25-30 | 81 | 79-83 |
| Household income | ||||||
| < $15,000 | 46 | 38-54 | 65 | 57-72 | 49 | 39-59 |
| $15,000 to $24,999 | 54 | 48-59 | 62 | 56-67 | 55 | 49-61 |
| $25,000 to $49,999 | 61 | 57-65 | 53 | 48-57 | 63 | 58-67 |
| $50,000 to $74,999 | 71 | 67-76 | 42 | 37-47 | 73 | 68-77 |
| $75,000+ | 79 | 77-82 | 31 | 28-34 | 80 | 77-83 |
| Race | ||||||
| White, non-Hispanic | 71 | 69-72 | 44 | 42-46 | 72 | 70-74 |
| Black, non-Hispanic | 58 | 53-64 | 47 | 42-53 | 57 | 51-63 |
| Hispanic | 63 | 54-70 | 36 | 29-44 | 64 | 54-74 |
*Excludes missing, don't know and refused
**Due to tooth decay or gum disease
Visited a Dentist in the Past Year Prevalence per 1,000 Pennsylvania Population,
Pennsylvania Adults, 2012-2020
Color bands around estimates show 95% confidence intervals
Opioid Use, Pennsylvania Adults, 2020
| Used Any Prescription Pain Medications in the Past Year* | Used Prescription Pain Medicines Not Prescribed to You in the Past Year* | Used Non-Prescription Street Drugs That Were Injected or Snorted in the Past Year* | ||||
|---|---|---|---|---|---|---|
| Demographics | % | CI | % | CI | % | CI |
| All adults | 28 | 26-29 | 6 | 4-8 | 2 | 1-2 |
| Gender | ||||||
| Male | 26 | 24-29 | 7 | 5-10 | 2 | 1-3 |
| Female | 29 | 26-32 | 5 | 3-9 | 1 | 1-3 |
| Age | ||||||
| 18-29 | 19 | 15-24 | NSR | NSR | 2 | 1-5 |
| 30-44 | 23 | 19-27 | 7 | 4-13 | 4 | 2-6 |
| 45-64 | 27 | 24-30 | 5 | 3-8 | 1 | 0-2 |
| 65+ | 38 | 34-42 | 4 | 3-7 | 1 | 0-2 |
| Education | ||||||
| < High school | 35 | 26-44 | NSR | NSR | 3 | 1-10 |
| High school | 28 | 25-31 | 6 | 4-9 | 1 | 1-2 |
| Some college | 29 | 26-33 | 5 | 3-10 | 2 | 1-4 |
| College degree | 24 | 22-26 | 7 | 5-11 | 1 | 1-2 |
| Household income | ||||||
| < $15,000 | 43 | 34-52 | 4 | 2-12 | 3 | 1-8 |
| $15,000 to $24,999 | 37 | 31-43 | 8 | 4-15 | 2 | 1-5 |
| $25,000 to $49,999 | 31 | 27-36 | 7 | 3-17 | 3 | 2-7 |
| $50,000 to $74,999 | 24 | 20-29 | 7 | 3-12 | 1 | 0-2 |
| $75,000+ | 22 | 19-25 | 6 | 3-11 | 1 | 0-2 |
| Race | ||||||
| White, non-Hispanic | 27 | 25-29 | 5 | 4-7 | 1 | 1-2 |
| Black, non-Hispanic | 34 | 28-40 | 10 | 5-19 | 4 | 2-8 |
| Hispanic | 32 | 23-43 | NSR | NSR | NSR | NSR |
*Excludes missing, don't know and refused
Note: If "NSR" is displayed, then the total response is less than 50 and/or the percentage prevalence is considered "not statistically reliable."
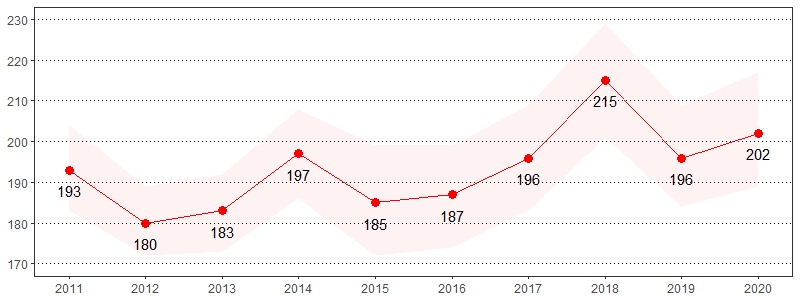
Used Any Prescription Paid Medications in the Past Year Prevalence per 1,000 Pennsylvania Population,
Pennsylvania Adults, 2017-2020
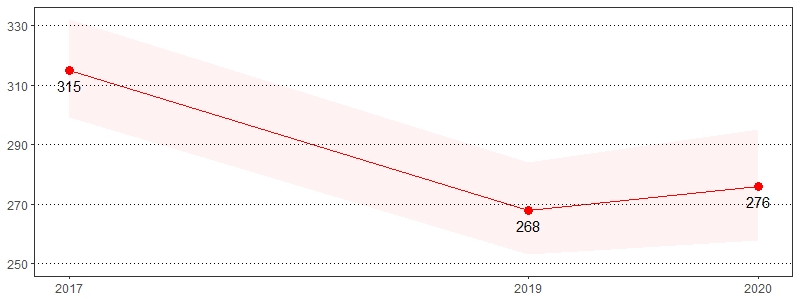
Color bands around estimates show 95% confidence intervals
Overweight and Obese, Pennsylvania Adults, 2020
| Overweight* (BMI 25-29) |
Obese* (BMI >= 30) |
Overweight & Obese* (BMI >= 25) |
||||
|---|---|---|---|---|---|---|
| Demographics | % | CI | % | CI | % | CI |
| All adults | 36 | 34-37 | 31 | 30-33 | 67 | 65-69 |
| Gender | ||||||
| Male | 41 | 38-43 | 31 | 29-33 | 71 | 69-74 |
| Female | 31 | 28-33 | 32 | 30-35 | 63 | 60-65 |
| Age | ||||||
| 18-29 | 28 | 24-32 | 22 | 19-27 | 50 | 45-55 |
| 30-44 | 34 | 30-38 | 34 | 30-38 | 68 | 64-71 |
| 45-64 | 39 | 36-42 | 37 | 35-40 | 77 | 74-79 |
| 65+ | 39 | 36-43 | 29 | 26-32 | 68 | 65-72 |
| Education | ||||||
| < High school | 32 | 25-41 | 39 | 31-47 | 71 | 63-78 |
| High school | 34 | 31-37 | 33 | 30-37 | 68 | 64-71 |
| Some college | 37 | 33-40 | 33 | 29-36 | 69 | 66-73 |
| College degree | 38 | 35-40 | 26 | 23-28 | 63 | 61-66 |
| Household income | ||||||
| < $15,000 | 28 | 20-38 | 43 | 35-51 | 71 | 63-78 |
| $15,000 to $24,999 | 33 | 28-38 | 34 | 29-39 | 66 | 61-72 |
| $25,000 to $49,999 | 39 | 34-43 | 32 | 28-36 | 71 | 66-75 |
| $50,000 tot $74,999 | 37 | 33-42 | 35 | 30-40 | 72 | 67-77 |
| $75,000+ | 37 | 34-40 | 29 | 26-32 | 66 | 63-69 |
| Race | ||||||
| White, non-Hispanic | 37 | 35-39 | 32 | 30-34 | 68 | 66-70 |
| Black, non-Hispanic | 31 | 26-37 | 39 | 34-45 | 70 | 64-76 |
| Hispanic | 33 | 26-41 | 31 | 24-39 | 64 | 55-73 |
*Excludes missing, don't know and refused
Note: The Body Mass Index (BMI), which describes relative weight for height, is significantly correlated with total body fat content. BMI is calculated as mass (kg)/height2 (m2) and estimated using pounds and inches by [weight (pound)/height2 (inches2)] x 703. Individuals with a BMI of 25 to 29.9 are considered overweight, while individuals with a BMI >= 30 are considered obese.
Overweight and Obese Prevalence per 1,000 Pennsylvania Population,
Pennsylvania Adults, 2011-2020
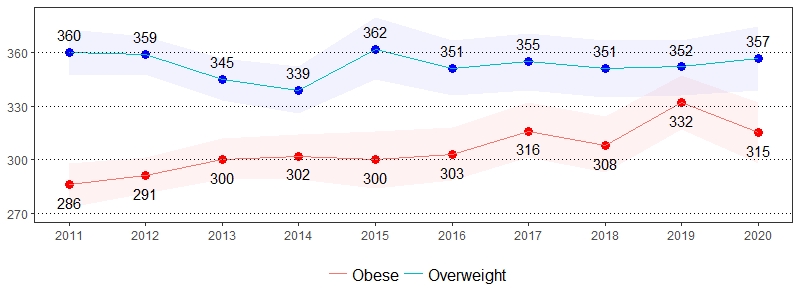
Color bands around estimates show 95% confidence intervals
Pap Test, Pennsylvania Women, 2020
| Ever Had a Pap Test* | Had a Pap Test in the Past 3 Years* | Had a Pap Test in the Past 5 Years* | Ever Had a Hysterectomy* | |||||
|---|---|---|---|---|---|---|---|---|
| Demographics | % | CI | % | CI | % | CI | % | CI |
| Gender | ||||||||
| Female | 89 | 86-90 | 62 | 60-65 | 69 | 66-72 | 19 | 17-21 |
| Age | ||||||||
| 18-29 | 58 | 50-65 | 54 | 47-62 | 57 | 49-64 | 1 | 0-5 |
| 30-44 | 95 | 92-97 | 83 | 78-86 | 87 | 83-90 | 5 | 3-8 |
| 45-64 | 97 | 95-98 | 75 | 71-78 | 82 | 78-85 | 23 | 20-27 |
| 65+ | 95 | 93-97 | 36 | 31-41 | 46 | 41-52 | 39 | 34-44 |
| Education | ||||||||
| < High school | 81 | 70-89 | 46 | 34-58 | 50 | 38-62 | 27 | 17-41 |
| High school | 86 | 82-90 | 54 | 49-59 | 60 | 56-65 | 25 | 21-29 |
| Some college | 86 | 81-90 | 63 | 58-68 | 70 | 65-75 | 19 | 15-23 |
| College degree | 95 | 94-97 | 76 | 73-79 | 83 | 80-85 | 10 | 9-13 |
| Household income | ||||||||
| < $15,000 | 85 | 77-91 | 47 | 36-59 | 51 | 40-63 | 31 | 20-45 |
| $15,000 to $24,999 | 88 | 81-92 | 53 | 45-61 | 62 | 54-69 | 24 | 18-31 |
| $25,000 to $49,999 | 89 | 84-93 | 62 | 56-68 | 69 | 63-74 | 18 | 14-23 |
| $50,000 to $74,999 | 97 | 93-99 | 72 | 65-78 | 77 | 70-82 | 23 | 17-30 |
| $75,000+ | 89 | 84-93 | 72 | 67-77 | 78 | 73-82 | 13 | 10-17 |
| Race | ||||||||
| White, non-Hispanic | 91 | 89-93 | 61 | 58-64 | 68 | 65-71 | 20 | 18-23 |
| Black, non-Hispanic | 89 | 83-93 | 74 | 66-80 | 81 | 73-86 | 21 | 15-28 |
| Hispanic | 78 | 67-86 | 64 | 53-74 | 68 | 57-77 | 13 | 7-23 |
*Excludes missing, don't know and refused
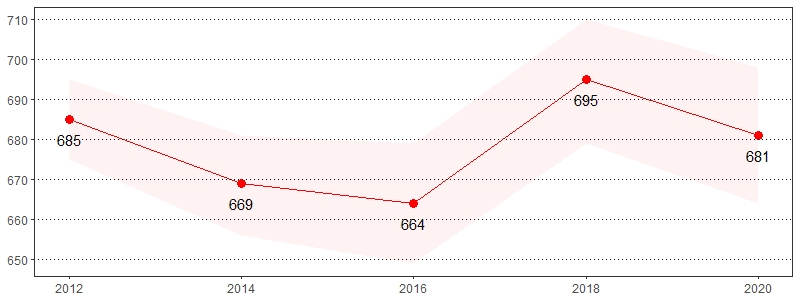
Pap Test Prevalence per 1,000 Pennsylvania Population,
Pennsylvania Women, 2012-2020
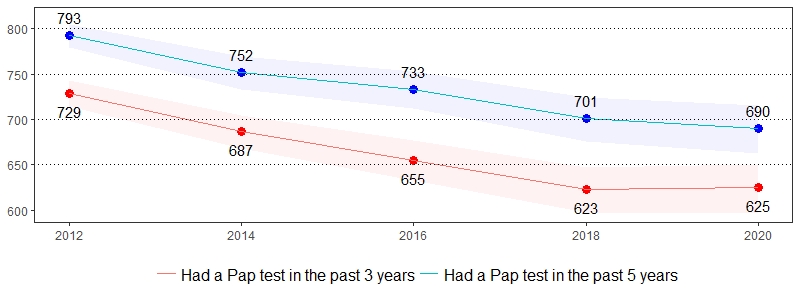
Color bands around estimates show 95% confidence intervals
Physical Impairments, Pennsylvania Adults, 2020
| Have Difficulty Making Decisions Due to Health Condition* ** |
Have Difficulty Walking or Climbing Stairs* |
Have Difficulty Dressing or Bathing* | Have Difficulty Doing Errands Alone Due to Health Condition* ** | |||||
|---|---|---|---|---|---|---|---|---|
| Demographics | % | CI | % | CI | % | CI | % | CI |
| All adults | 11 | 10-12 | 13 | 12-15 | 4 | 3-4 | 7 | 6-8 |
| Gender | ||||||||
| Male | 9 | 7-10 | 11 | 9-12 | 3 | 2-4 | 5 | 4-6 |
| Female | 13 | 11-15 | 16 | 14-18 | 4 | 3-5 | 10 | 8-11 |
| Age | ||||||||
| 18-29 | 13 | 10-16 | 2 | 1-4 | 1 | 0-3 | 5 | 4-8 |
| 30-44 | 14 | 11-17 | 6 | 4-8 | 2 | 1-3 | 6 | 4-8 |
| 45-64 | 9 | 8-11 | 15 | 13-17 | 5 | 4-7 | 8 | 6-9 |
| 65+ | 9 | 7-12 | 27 | 24-31 | 5 | 4-7 | 10 | 8-13 |
| Education | ||||||||
| < High school | 26 | 19-33 | 27 | 21-35 | 8 | 5-13 | 18 | 12-25 |
| High school | 13 | 11-15 | 16 | 14-18 | 4 | 3-5 | 8 | 7-10 |
| Some college | 10 | 8-12 | 13 | 11-15 | 4 | 3-6 | 7 | 6-9 |
| College degree | 5 | 4-6 | 6 | 5-7 | 1 | 1-2 | 3 | 2-4 |
| Household income | ||||||||
| < $15,000 | 35 | 27-44 | 38 | 30-47 | 13 | 8-19 | 29 | 21-38 |
| $15,000 to $24,999 | 15 | 12-20 | 29 | 24-34 | 9 | 7-13 | 18 | 14-23 |
| $25,000 to $49,999 | 13 | 10-16 | 14 | 11-17 | 3 | 2-5 | 7 | 5-9 |
| $50,000 to $74,999 | 7 | 5-10 | 7 | 5-10 | 1 | 1-3 | 2 | 1-4 |
| $75,000+ | 4 | 3-5 | 5 | 4-7 | 1 | 1-2 | 2 | 1-3 |
| Race | ||||||||
| White, non-Hispanic | 10 | 9-11 | 13 | 12-15 | 3 | 2-4 | 7 | 6-8 |
| Black, non-Hispanic | 11 | 8-15 | 18 | 14-23 | 7 | 4-11 | 10 | 7-14 |
| Hispanic | 23 | 17-31 | 14 | 9-20 | 7 | 4-11 | 13 | 9-19 |
*Excludes missing, don't know and refused
**Includes physical, mental or emotional problems
Physical Impairments Prevalence per 1,000 Pennsylvania Population,
Pennsylvania Adults, 2013-2020
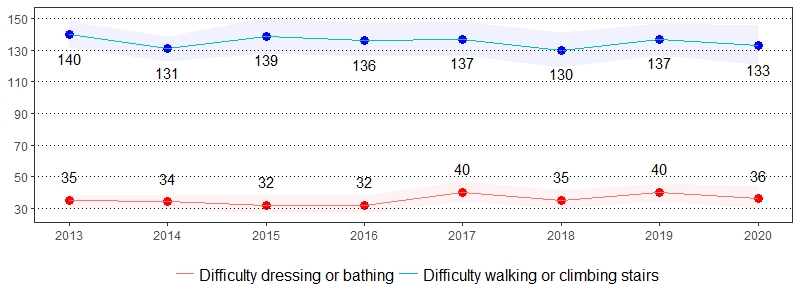
Color bands around estimates show 95% confidence intervals
Prostate Cancer Screening, Pennsylvania Men, 2020
| Health Professional Ever Recommended PSA Test, Age GE 40* |
Ever Had a PSA Test, Age GE 50* |
Had a PSA Test in the Past Year, Age GE 50* | ||||
|---|---|---|---|---|---|---|
| Demographics | % | CI | % | CI | % | CI |
| Gender | ||||||
| Male | 41 | 38-44 | 54 | 50-57 | 63 | 58-67 |
| Age | ||||||
| 40-49 | 9 | 6-13 | NSR | NSR | NSR | NSR |
| 50-64 | 42 | 37-47 | 42 | 38-47 | 63 | 56-69 |
| 65-74 | 62 | 55-68 | 70 | 63-75 | 65 | 57-73 |
| 75+ | 56 | 46-65 | 60 | 51-69 | 58 | 47-69 |
| Education | ||||||
| < High school | NSR | NSR | NSR | NSR | NSR | NSR |
| High school | 36 | 31-42 | 48 | 42-54 | 63 | 54-72 |
| Some college | 40 | 34-47 | 55 | 48-62 | 63 | 53-73 |
| College degree | 52 | 48-57 | 69 | 64-73 | 63 | 56-69 |
| Household income | ||||||
| < $15,000 | 19 | 12-30 | 22 | 13-35 | NSR | NSR |
| $15,000 to $24,999 | 36 | 26-47 | 44 | 33-56 | NSR | NSR |
| $25,000 to $49,999 | 43 | 36-51 | 53 | 45-62 | 69 | 58-79 |
| $50,000 to $74,999 | 40 | 32-48 | 52 | 44-61 | 60 | 47-72 |
| $75,000+ | 45 | 40-50 | 63 | 57-68 | 68 | 61-74 |
| Race | ||||||
| White, non-Hispanic | 45 | 41-48 | 55 | 52-59 | 64 | 59-69 |
| Black, non-Hispanic | 29 | 20-40 | 47 | 34-60 | NSR | NSR |
| Hispanic | NSR | NSR | NSR | NSR | NSR | NSR |
*Excludes missing, don't know and refused
Note: If "NSR" is displayed, then the total response is less than 50 and/or the percentage prevalence is considered "not statistically reliable."
Had a PSA Test in the Past Year Prevalence per 1,000 Pennsylvania Population,
Pennsylvania Men, Age 50+, 2012-2020
Color bands around estimates show 95% confidence intervals
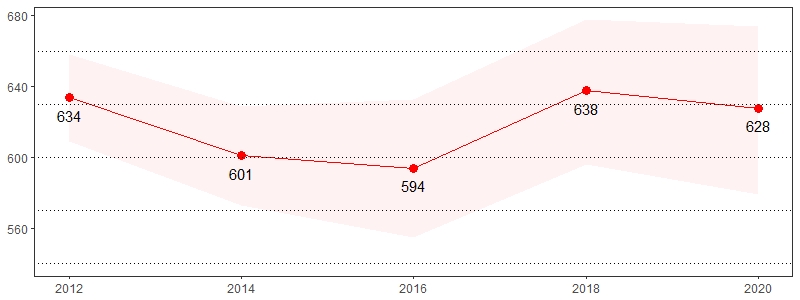
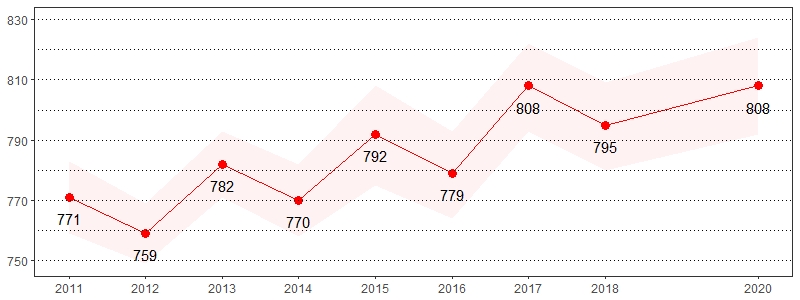
Quality of Life, Pennsylvania Adults, 2020
| Physical Health Not Good 1+ Days in the Past Month* |
Mental Health Not Good 1+ Days in the Past Month* |
|||
|---|---|---|---|---|
| Demographics | % | CI | % | CI |
| All adults | 30 | 28-32 | 38 | 37-40 |
| Gender | ||||
| Male | 27 | 25-29 | 31 | 29-33 |
| Female | 33 | 31-36 | 46 | 43-48 |
| Age | ||||
| 18-29 | 30 | 26-35 | 51 | 47-56 |
| 30-44 | 27 | 24-30 | 48 | 45-52 |
| 45-64 | 29 | 26-31 | 35 | 32-38 |
| 65+ | 35 | 32-39 | 23 | 20-26 |
| Education | ||||
| < High school | 32 | 25-40 | 39 | 32-47 |
| High school | 31 | 28-34 | 33 | 30-36 |
| Some college | 34 | 31-38 | 43 | 40-47 |
| College degree | 24 | 22-27 | 41 | 38-43 |
| Household income | ||||
| < $15,000 | 51 | 43-59 | 59 | 52-66 |
| $15,000 to $24,999 | 41 | 35-46 | 38 | 34-44 |
| $25,000 to $49,999 | 31 | 28-36 | 43 | 38-47 |
| $50,000 to $74,999 | 26 | 22-31 | 37 | 33-42 |
| $75,000+ | 24 | 21-27 | 37 | 34-40 |
| Race | ||||
| White, non-Hispanic | 30 | 28-32 | 38 | 36-40 |
| Black, non-Hispanic | 29 | 24-34 | 37 | 32-42 |
| Hispanic | 36 | 28-45 | 47 | 39-55 |
*Excludes missing, don't know and refused
Poor Physical and Mental Health Prevalence per 1,000 Pennsylvania Population,
Pennsylvania Adults, 2011-2020
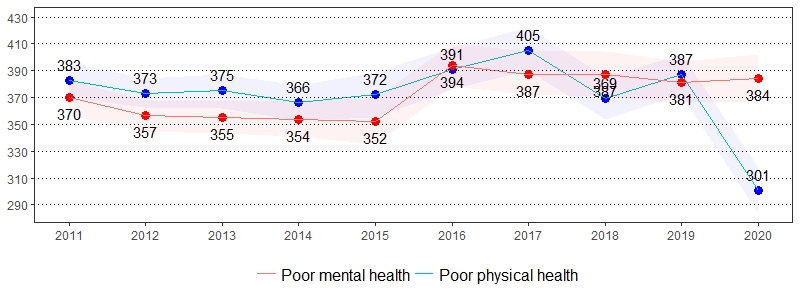
Color bands around estimates show 95% confidence intervals
Seatbelt Use, Pennsylvania Adults, 2020
| Always Use Seatbelts When Driving or Riding in a Car* | Always or Nearly Always Use Seatbelts When Driving or Riding in a Car* | Seldom or Never Use Seatbelts When Driving or Riding in a Car* | ||||
|---|---|---|---|---|---|---|
| Demographics | % | CI | % | CI | % | CI |
| All adults | 81 | 79-82 | 90 | 88-91 | 6 | 5-7 |
| Gender | ||||||
| Male | 78 | 75-80 | 88 | 86-90 | 7 | 6-8 |
| Female | 84 | 82-86 | 92 | 90-93 | 4 | 3-6 |
| Age | ||||||
| 18-29 | 75 | 71-79 | 89 | 85-91 | 6 | 4-9 |
| 30-44 | 79 | 76-83 | 89 | 86-91 | 6 | 4-8 |
| 45-64 | 83 | 80-85 | 91 | 89-92 | 5 | 4-7 |
| 65+ | 85 | 81-87 | 90 | 87-93 | 5 | 3-9 |
| Education | ||||||
| < High school | 65 | 57-73 | 75 | 67-82 | 15 | 9-23 |
| High school | 78 | 75-80 | 86 | 84-89 | 7 | 5-9 |
| Some college | 81 | 78-84 | 92 | 91-94 | 4 | 3-6 |
| College degree | 90 | 88-91 | 96 | 95-97 | 2 | 2-3 |
| Household income | ||||||
| < $15,000 | 69 | 59-77 | 78 | 69-86 | 11 | 5-23 |
| $15,000 to $24,999 | 75 | 70-80 | 83 | 78-87 | 8 | 5-13 |
| $25,000 to $49,999 | 81 | 77-84 | 89 | 87-92 | 6 | 4-9 |
| $50,000 to $74,999 | 78 | 73-82 | 89 | 84-92 | 5 | 3-9 |
| $75,000+ | 86 | 83-89 | 95 | 93-96 | 3 | 2-5 |
| Race | ||||||
| White, non-Hispanic | 81 | 79-83 | 90 | 89-92 | 6 | 4-7 |
| Black, non-Hispanic | 78 | 73-83 | 87 | 82-90 | 7 | 4-11 |
| Hispanic | 85 | 79-89 | 90 | 84-93 | 5 | 2-9 |
*Excludes missing, don't know and refused
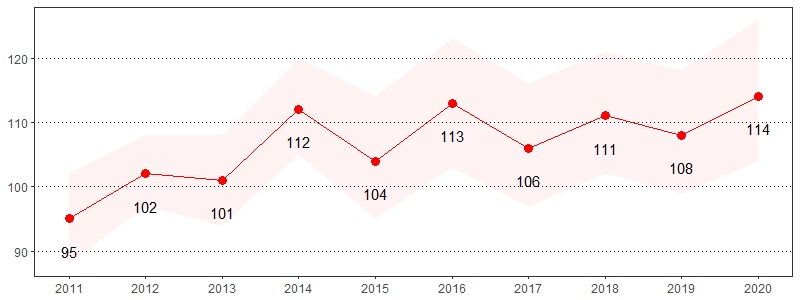
Always Use a Seatbelt Prevalence per 1,000 Pennsylvania Population,
Pennsylvania Adults, 2011-2020
Color bands around estimates show 95% confidence intervals
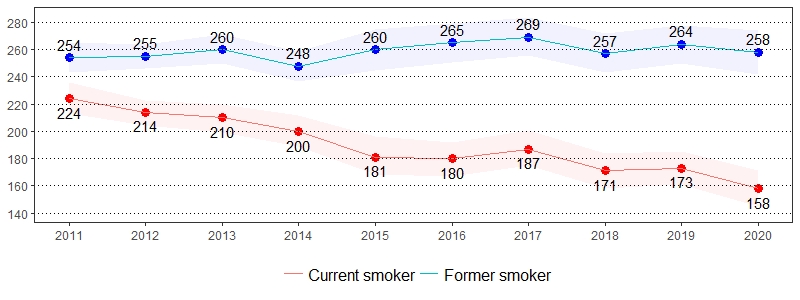
Tobacco Use, Pennsylvania Adults, 2020
| Current Smoker* ** | Currently Use Chewing Tobacco, Snuff or Snus* *** |
Former Smoker* | Quit at Least 1 Day in the Past Year* ** |
|||||
|---|---|---|---|---|---|---|---|---|
| Demographics | % | CI | % | CI | % | CI | % | CI |
| All adults | 16 | 15-17 | 4 | 4-5 | 26 | 24-27 | 47 | 42-52 |
| Gender | ||||||||
| Male | 17 | 15-19 | 7 | 6-9 | 28 | 26-30 | 46 | 39-54 |
| Female | 15 | 13-17 | 1 | 1-2 | 24 | 21-26 | 48 | 41-55 |
| Age | ||||||||
| 18-29 | 12 | 9-15 | 5 | 3-7 | 11 | 8-14 | NSR | NSR |
| 30-44 | 23 | 20-26 | 5 | 4-7 | 22 | 19-25 | 47 | 38-56 |
| 45-64 | 18 | 16-20 | 5 | 4-7 | 26 | 24-29 | 43 | 36-50 |
| 65+ | 10 | 8-13 | 2 | 1-3 | 40 | 37-44 | NSR | NSR |
| Education | ||||||||
| < High school | 26 | 20-33 | 5 | 3-10 | 28 | 22-36 | NSR | NSR |
| High school | 20 | 17-22 | 6 | 4-7 | 27 | 24-29 | 47 | 39-54 |
| Some college | 18 | 15-21 | 4 | 3-6 | 27 | 24-31 | 48 | 38-57 |
| College degree | 6 | 5-7 | 2 | 2-3 | 22 | 20-24 | 47 | 34-59 |
| Household income | ||||||||
| < $15,000 | 32 | 25-40 | 4 | 2-9 | 21 | 16-28 | NSR | NSR |
| $15,000 to $24,999 | 24 | 20-29 | 4 | 3-6 | 29 | 24-34 | 51 | 39-63 |
| $25,000 to $49,999 | 20 | 17-24 | 5 | 3-7 | 27 | 23-31 | 52 | 42-63 |
| $50,000 to $74,999 | 13 | 10-16 | 6 | 4-10 | 32 | 28-37 | NSR | NSR |
| $75,000+ | 10 | 8-12 | 4 | 3-5 | 25 | 22-27 | 37 | 27-46 |
| Race | ||||||||
| White, non-Hispanic | 15 | 14-17 | 5 | 4-6 | 29 | 27-31 | 46 | 41-52 |
| Black, non-Hispanic | 21 | 17-26 | 2 | 1-4 | 19 | 15-24 | NSR | NSR |
| Hispanic | 19 | 13-27 | 2 | 1-4 | 14 | 10-20 | NSR | NSR |
*Excludes missing, don't know and refused
**Includes adults who smoke cigarettes every day or some days
***Includes adults who currently use chewing tobacco, snuff or snus every day or some days
Note: If "NSR" is displayed, then the total response is less than 50 and/or the percentage prevalence is considered "not statistically reliable."
Tobacco Use Prevalence per 1,000 Pennsylvania Population,
Pennsylvania Adults, 2011-2020