Tables and trend lines by topic
Adverse childhood experiences (ACEs) are potentially traumatic events that can have negative, lasting effects on health and well-being.1 Nearly one in eight children (12 percent) have had three or more negative life experiences associated with levels of stress that can harm their health and development.2 The estimate(s) of adults who indicated that, before age 18, they lived with anyone who was depressed, mentally ill or suicidal; before age 18, they lived with anyone who was a problem drinker or alcoholic; before age 18, they lived with anyone who used illegal street drugs or abused prescription medications; or before age 18, they lived with anyone who was sentenced to serve time in a prison, jail or other correctional facility are shown below.
Adverse Childhood Experiences, Pennsylvania Adults, 2019
| Before Age 18, Lived With Anyone Who Was Depressed, Mentally Ill or Suicidal* |
Before Age 18, Lived With Anyone Who Was a Problem Drinker or Alcoholic* |
Before Age 18, Lived With Anyone Who Used Illegal Street Drugs or Abused Prescriptions* |
Before Age 18, Lived With Anyone Who Was Sentenced to Serve Time in Prison* |
|||||
|---|---|---|---|---|---|---|---|---|
| Demographics | % | CI | % | CI | % | CI | % | CI |
| All adults | 19 | 18-21 | 24 | 23-26 | 13 | 12-14 | 10 | 9-11 |
| Gender | ||||||||
| Male | 16 | 14-18 | 22 | 20-24 | 13 | 12-15 | 11 | 10-13 |
| Female | 23 | 21-25 | 27 | 25-29 | 12 | 11-14 | 9 | 8-11 |
| Age | ||||||||
| 18-29 | 34 | 29-38 | 28 | 24-32 | 19 | 16-23 | 19 | 15-22 |
| 30-44 | 24 | 21-28 | 27 | 24-31 | 22 | 19-26 | 17 | 14-20 |
| 45-64 | 16 | 15-19 | 26 | 24-28 | 10 | 9-12 | 7 | 6-9 |
| 65+ | 9 | 8-11 | 17 | 15-20 | 3 | 2-4 | 3 | 2-4 |
| Education | ||||||||
| < High school | 20 | 15-27 | 28 | 21-35 | 20 | 15-27 | 18 | 13-25 |
| High school | 17 | 14-19 | 25 | 23-28 | 13 | 11-15 | 12 | 10-14 |
| Some college | 23 | 20-26 | 27 | 24-30 | 13 | 11-16 | 11 | 9-13 |
| College degree | 20 | 18-22 | 20 | 18-22 | 9 | 8-11 | 5 | 4-6 |
| Household income | ||||||||
| < $15,000 | 22 | 17-28 | 30 | 24-37 | 19 | 14-25 | 13 | 9-19 |
| $15,000 to $24,999 | 20 | 16-25 | 27 | 23-32 | 14 | 11-19 | 15 | 11-19 |
| $25,000 to $49,999 | 22 | 19-25 | 27 | 24-31 | 15 | 13-19 | 13 | 10-16 |
| $50,000 to $74,999 | 19 | 16-23 | 24 | 20-28 | 11 | 9-14 | 10 | 7-13 |
| $75,000+ | 19 | 17-22 | 22 | 19-24 | 11 | 9-13 | 7 | 5-9 |
| Race | ||||||||
| White, non-Hispanic | 20 | 18-21 | 24 | 23-26 | 11 | 10-12 | 8 | 7-9 |
| Black, non-Hispanic | 17 | 13-21 | 25 | 21-31 | 22 | 18-27 | 21 | 17-27 |
| Hispanic | 27 | 20-35 | 27 | 20-35 | 21 | 15-29 | 21 | 15-29 |
*Excludes missing, don't know and refused
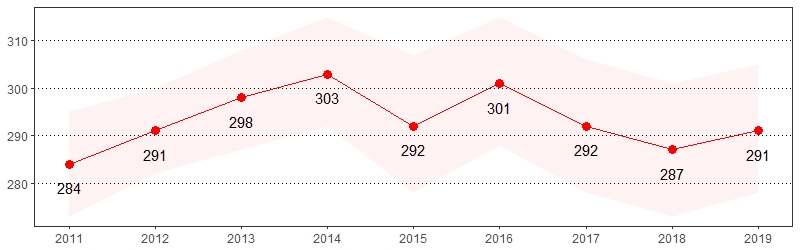
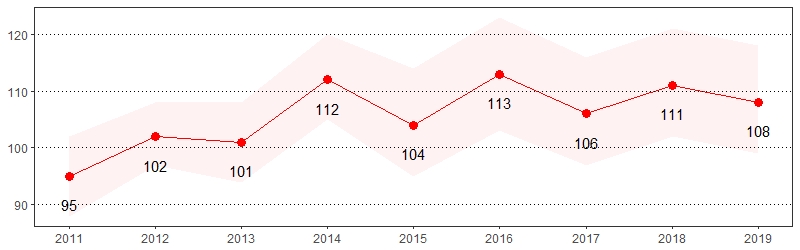
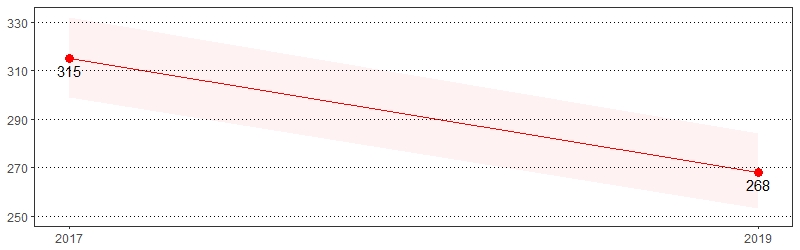
Before Age 18, Lived with Anyone Who Was Depressed, Mentally Ill or Suicidal Prevalence
per 1,000 Pennsylvania Population, Pennsylvania Adults, 2014-2019
Color shading around estimates show 95% confidence intervals
Excessive alcohol use contributes to approximately 88,000 deaths each year within the United States.3 The estimate(s) of adults who indicated binge drinking, chronic drinking or being at risk for problem drinking are shown below.
Alcohol Consumption, Pennsylvania Adults, 2019
| Binge Drinking* ** | At Risk for Problem Drinking* *** | Chronic Drinking* **** | ||||
|---|---|---|---|---|---|---|
| Demographics | % | CI | % | CI | % | CI |
| All adults | 17 | 16-18 | 6 | 5-7 | 6 | 5-7 |
| Gender | ||||||
| Male | 22 | 20-24 | 6 | 5-8 | 9 | 8-11 |
| Female | 12 | 11-14 | 6 | 5-7 | 3 | 2-4 |
| Age | ||||||
| 18-29 | 31 | 27-35 | 9 | 7-13 | 8 | 6-11 |
| 30-44 | 22 | 20-25 | 6 | 5-8 | 5 | 4-6 |
| 45-64 | 14 | 12-16 | 6 | 5-8 | 7 | 6-9 |
| 65+ | 5 | 4-7 | 3 | 2-4 | 4 | 3-6 |
| Education | ||||||
| < High school | 14 | 10-19 | 4 | 2-6 | 5 | 3-9 |
| High school | 16 | 13-18 | 7 | 6-9 | 7 | 6-9 |
| Some college | 19 | 17-21 | 6 | 5-8 | 6 | 5-7 |
| College degree | 18 | 16-20 | 6 | 5-7 | 5 | 4-7 |
| Household income | ||||||
| < $15,000 | 14 | 11-19 | 5 | 3-9 | 5 | 3-8 |
| $15,000 to $24,999 | 13 | 10-17 | 5 | 3-7 | 5 | 3-8 |
| $25,000 to $49,999 | 15 | 13-18 | 7 | 5-9 | 6 | 5-8 |
| $50,000 to $74,999 | 17 | 14-20 | 5 | 4-8 | 7 | 5-9 |
| $75,000+ | 21 | 19-23 | 7 | 6-9 | 7 | 6-8 |
| Race | ||||||
| White, non-Hispanic | 18 | 16-19 | 6 | 5-7 | 6 | 6-7 |
| Black, non-Hispanic | 15 | 11-18 | 5 | 4-8 | 5 | 3-8 |
| Hispanic | 20 | 15-27 | 8 | 5-12 | 6 | 4-11 |
*Excludes missing, don't know and refused
**Defined as having five or more drinks on one occasion for men and having four or more drinks on one occasion for women
***Defined as adult men having more than 14 drinks per week and adult women having more than seven drinks per week
****Defined as having an average of two drinks or more every day for the past 30 days
Alcohol Consumption Prevalence per 1,000 Pennsylvania Population,
Pennsylvania Adults, 2011-2019
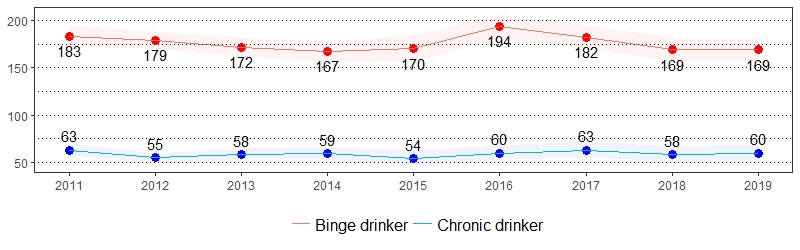
Color shading around estimates show 95% confidence intervals
Arthritis and rheumatism are the leading causes of disability within the United States. Symptoms of arthritis include pain, aching, stiffness and swelling in or around the joints.4 Approximately 23.7 million, or 43.5 percent of United States adults report limitations in their usual activities due to arthritis.5 The estimate(s) of adults who indicated they were ever told they have some form of arthritis, rheumatoid arthritis, gout, lupus or fibromyalgia, indicated their usual activities were limited due to arthritis or joint symptoms, indicated arthritis or joint symptoms affected their work or taken a class to manage arthritis or joint symptoms are shown below.
Arthritis, Pennsylvania Adults, 2019
| Ever Told Have Some Form of Arthritis* | Usual Activities Limited Due to Arthritis or Joint Symptoms* ** | Arthritis or Joint Symptoms Affected Work* ** | Taken Class to Manage Arthritis or Joint Symptoms* ** | |||||
|---|---|---|---|---|---|---|---|---|
| Demographics | % | CI | % | CI | % | CI | % | CI |
| All adults | 29 | 28-30 | 37 | 35-40 | 30 | 28-33 | 13 | 11-15 |
| Gender | ||||||||
| Male | 25 | 23-27 | 37 | 33-41 | 32 | 28-36 | 13 | 10-16 |
| Female | 33 | 31-35 | 37 | 34-41 | 29 | 26-32 | 13 | 11-16 |
| Age | ||||||||
| 18-29 | 4 | 3-6 | NSR | NSR | NSR | NSR | NSR | NSR |
| 30-44 | 13 | 11-15 | 41 | 32-51 | 39 | 31-48 | 15 | 9-22 |
| 45-64 | 37 | 35-40 | 44 | 40-48 | 41 | 37-45 | 13 | 11-16 |
| 65+ | 54 | 51-57 | 31 | 27-34 | 18 | 15-21 | 13 | 10-16 |
| Education | ||||||||
| < High school | 31 | 25-37 | 50 | 39-60 | 44 | 34-55 | 14 | 8-23 |
| High school | 33 | 31-36 | 36 | 32-40 | 28 | 25-32 | 10 | 7-12 |
| Some college | 28 | 26-31 | 35 | 30-40 | 34 | 29-39 | 16 | 12-21 |
| College degree | 24 | 22-25 | 35 | 31-39 | 22 | 18-25 | 15 | 12-18 |
| Household income | ||||||||
| < $15,000 | 40 | 34-46 | 58 | 49-67 | 45 | 36-54 | 13 | 8-20 |
| $15,000 to $24,999 | 40 | 35-44 | 53 | 46-60 | 43 | 37-50 | 13 | 9-19 |
| $25,000 to $49,999 | 30 | 27-34 | 33 | 28-39 | 29 | 24-35 | 13 | 9-17 |
| $50,000 to $74,999 | 31 | 27-35 | 31 | 25-38 | 29 | 23-36 | 11 | 8-16 |
| $75,000+ | 22 | 20-24 | 31 | 26-36 | 20 | 16-25 | 14 | 10-17 |
| Race | ||||||||
| White, non-Hispanic | 32 | 30-33 | 36 | 33-39 | 28 | 26-31 | 13 | 11-15 |
| Black, non-Hispanic | 25 | 22-30 | 41 | 32-50 | 31 | 24-40 | 13 | 9-18 |
| Hispanic | 16 | 12-22 | NSR | NSR | NSR | NSR | NSR | NSR |
*Excludes missing, don't know and refused
Note: If "NSR" is displayed, then the total response is less than 50 and/or the percentage prevalence is considered "not statistically reliable."
**Out of adults who were told they have some form or arthritis
Arthritis Prevalence per 1,000 Pennsylvania Population,
Pennsylvania Adults, 2011-2019
Color shading around estimates show 95% confidence intervals
Asthma is a chronic inflammatory disorder of the lungs, characterized by wheezing, coughing, difficulty breathing and chest tightness.6 The estimate(s) of adults who indicated they ever had asthma or currently have asthma are shown below.
Asthma, Pennsylvania Adults, 2019
| Ever Told Have Asthma* | Currently Has Asthma* | |||
|---|---|---|---|---|
| Demographics | % | CI | % | CI |
| All adults | 16 | 15-17 | 11 | 10-12 |
| Gender | ||||
| Male | 13 | 12-15 | 8 | 7-9 |
| Female | 18 | 16-20 | 14 | 12-15 |
| Age | ||||
| 18-29 | 23 | 20-27 | 15 | 13-19 |
| 30-44 | 17 | 15-20 | 10 | 8-13 |
| 45-64 | 13 | 12-15 | 11 | 9-12 |
| 65+ | 12 | 10-14 | 8 | 7-10 |
| Education | ||||
| < High school | 17 | 13-23 | 15 | 11-20 |
| High school | 14 | 12-16 | 10 | 8-12 |
| Some college | 18 | 16-21 | 12 | 10-15 |
| College degree | 14 | 13-16 | 9 | 8-10 |
| Household income | ||||
| < $15,000 | 23 | 19-29 | 21 | 16-26 |
| $15,000 to $24,999 | 20 | 16-24 | 16 | 13-19 |
| $25,000 to $49,999 | 17 | 15-20 | 13 | 11-16 |
| $50,000 to $74,999 | 14 | 12-18 | 10 | 7-12 |
| $75,000+ | 13 | 12-16 | 7 | 6-9 |
| Race | ||||
| White, non-Hispanic | 15 | 13-16 | 10 | 9-11 |
| Black, non-Hispanic | 21 | 17-26 | 17 | 14-21 |
| Hispanic | 23 | 18-30 | 15 | 11-21 |
*Excludes missing, don't know and refused
Asthma Prevalence per 1,000 Pennsylvania Population,
Pennsylvania Adults, 2011-2019
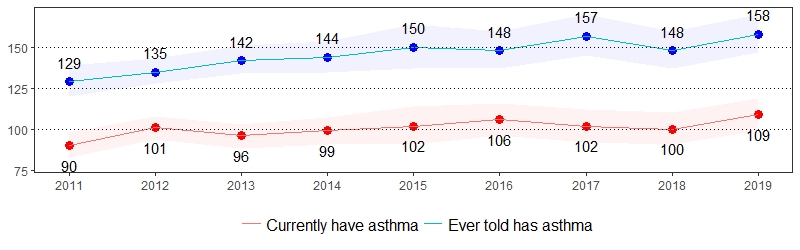
Color shading around estimates show 95% confidence intervals
Cancer is the second leading cause of death in the United States.7 The estimate(s) of adults who indicated they were ever told they had skin cancer and ever told they had any other type of cancer are shown below.
Cancer, Pennsylvania Adults, 2019
| Ever Told Had Skin Cancer* | Ever Told Had Any Other Type of Cancer* |
|||
|---|---|---|---|---|
| Demographics | % | CI | % | CI |
| All adults | 7 | 6-7 | 8 | 7-9 |
| Gender | ||||
| Male | 7 | 6-8 | 7 | 6-8 |
| Female | 7 | 6-8 | 9 | 8-10 |
| Age | ||||
| 18-29 | 0 | 0-1 | 1 | 0-1 |
| 30-44 | 1 | 0-1 | 3 | 2-4 |
| 45-64 | 7 | 5-8 | 8 | 7-9 |
| 65+ | 18 | 15-20 | 19 | 17-21 |
| Education | ||||
| < High school | 6 | 4-9 | 10 | 7-14 |
| High school | 7 | 5-8 | 9 | 7-10 |
| Some college | 5 | 4-7 | 8 | 6-9 |
| College degree | 8 | 7-9 | 7 | 6-8 |
| Household income | ||||
| < $15,000 | 4 | 2-6 | 11 | 7-15 |
| $15,000 to $24,999 | 6 | 5-9 | 11 | 8-14 |
| $25,000 to $49,999 | 7 | 6-9 | 8 | 7-10 |
| $50,000 to $74,999 | 7 | 6-9 | 8 | 6-10 |
| $75,000+ | 6 | 5-7 | 6 | 5-8 |
| Race | ||||
| White, non-Hispanic | 8 | 8-9 | 9 | 8-10 |
| Black, non-Hispanic | 1 | 0-2 | 6 | 5-9 |
| Hispanic | 0 | 0-1 | 3 | 2-6 |
*Excludes missing, don't know and refused
Cancer Prevalence per 1,000 Pennsylvania Population,
Pennsylvania Adults, 2011-2019
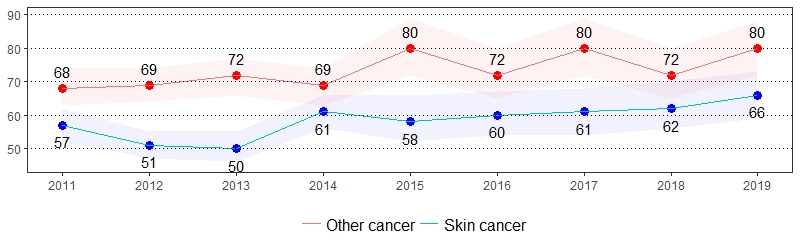
Color shading around estimates show 95% confidence intervals
Cardiovascular disease is the leading cause of death for men and women in the United States.8 The estimate(s) of adults age 35 and older who indicated they had a heart attack, heart disease or stroke, ever had a heart attack, ever had angina or heart disease, or ever had a stroke are shown below.
Cardiovascular Disease, Pennsylvania Adults, Age 35+, 2019
| Ever Told Had Heart Attack, Heart Disease or Stroke* | Ever Told They Had Angina or Heart Disease* | Ever Told They Had a Heart Attack* | Ever Told They Had a Stroke* | |||||
|---|---|---|---|---|---|---|---|---|
| Demographics | % | CI | % | CI | % | CI | % | CI |
| All adults | 12 | 11-14 | 5 | 5-6 | 6 | 5-7 | 5 | 4-6 |
| Gender | ||||||||
| Male | 14 | 13-16 | 6 | 5-8 | 8 | 7-10 | 5 | 4-6 |
| Female | 11 | 9-12 | 5 | 4-6 | 4 | 3-5 | 5 | 4-6 |
| Age | ||||||||
| 35-44 | 4 | 2-6 | 2 | 1-4 | 1 | 1-3 | 2 | 1-3 |
| 45-54 | 6 | 5-8 | 2 | 1-4 | 3 | 2-4 | 3 | 2-4 |
| 55-64 | 12 | 10-14 | 5 | 4-7 | 5 | 4-7 | 5 | 4-7 |
| 65+ | 22 | 20-25 | 10 | 9-12 | 12 | 10-14 | 8 | 7-10 |
| Education | ||||||||
| < High school | 20 | 15-26 | 6 | 4-10 | 9 | 6-14 | 10 | 6-14 |
| High school | 15 | 13-17 | 6 | 4-7 | 7 | 6-9 | 6 | 5-8 |
| Some college | 12 | 10-15 | 6 | 4-7 | 7 | 5-9 | 4 | 3-6 |
| College degree | 8 | 7-9 | 5 | 4-6 | 3 | 3-4 | 3 | 2-4 |
| Household income | ||||||||
| < $15,000 | 22 | 17-29 | 13 | 9-18 | 11 | 8-16 | 9 | 6-13 |
| $15,000 to $24,999 | 19 | 16-24 | 6 | 4-9 | 9 | 7-13 | 10 | 7-14 |
| $25,000 to $49,999 | 16 | 13-19 | 7 | 5-9 | 8 | 6-10 | 5 | 4-7 |
| $50,000 to $74,999 | 10 | 8-13 | 5 | 3-7 | 6 | 4-8 | 4 | 2-6 |
| $75,000+ | 6 | 5-7 | 3 | 3-5 | 2 | 2-3 | 2 | 1-3 |
| Race | ||||||||
| White, non-Hispanic | 12 | 11-14 | 5 | 5-6 | 7 | 6-8 | 5 | 4-5 |
| Black, non-Hispanic | 11 | 8-15 | 4 | 2-7 | 5 | 3-8 | 7 | 5-10 |
| Hispanic | 12 | 7-21 | 6 | 2-14 | 3 | 1-9 | 5 | 2-12 |
*Excludes missing, don't know and refused
Cardiovascular Disease Prevalence per 1,000 Pennsylvania Population,
Pennsylvania Adults, Age 35+, 2011-2019
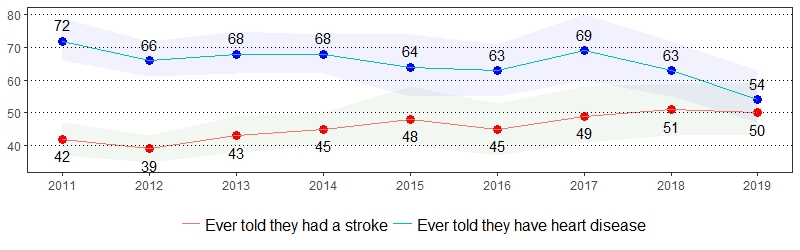
Color shading around estimates show 95% confidence intervals
Approximately 39.8 million caregivers, or 16.6 percent, provide care to adults with a disability or illness.9 The estimate(s) of adults who indicated they provided regular care or assistance to a friend or family member who has a health problem or disability in the past month, averaged up to eight hours per week in the past month providing care or assistance to a friend or family member who has a health problem or disability or averaged 40 hours or more per week in the past month providing care or assistance to a friend or family member who has a health problem or disability are shown below.
Caregiver, Pennsylvania Adults, 2019
| Provided Regular Care/Assistance to Friend/Family Member Who Has Health Problem/Disability in the Past Month* | Averaged Up to 8 Hours/Week in the Past Month Providing Care/Assistance to Friend/Family Member Who Has Health Problem/Disability* | Averaged 40 Hours or More per Week in the Past Month Providing Care/Assistance to Friend/Family Member Who Has Health Problem/Disability* | ||||
|---|---|---|---|---|---|---|
| Demographics | % | CI | % | CI | % | CI |
| All adults | 24 | 22-25 | 56 | 52-59 | 20 | 17-23 |
| Gender | ||||||
| Male | 20 | 18-22 | 61 | 56-67 | 17 | 14-22 |
| Female | 27 | 25-29 | 52 | 47-57 | 22 | 18-26 |
| Age | ||||||
| 18-29 | 21 | 17-25 | 60 | 49-71 | 14 | 8-25 |
| 30-44 | 21 | 18-24 | 56 | 47-64 | 20 | 15-27 |
| 45-64 | 27 | 25-30 | 54 | 49-59 | 19 | 15-24 |
| 65+ | 24 | 22-27 | 56 | 49-62 | 24 | 19-30 |
| Education | ||||||
| < High school | 20 | 15-27 | NSR | NSR | NSR | NSR |
| High school | 26 | 23-28 | 52 | 46-58 | 22 | 17-28 |
| Some college | 25 | 22-28 | 56 | 49-62 | 19 | 14-24 |
| College degree | 22 | 20-24 | 60 | 55-65 | 17 | 13-21 |
| Household income | ||||||
| < $15,000 | 21 | 16-27 | 27 | 17-41 | NSR | NSR |
| $15,000 to $24,999 | 29 | 24-34 | 52 | 41-62 | 22 | 15-31 |
| $25,000 to $49,999 | 26 | 23-30 | 49 | 41-57 | 24 | 18-31 |
| $50,000 to $74,999 | 24 | 20-27 | 53 | 44-62 | 23 | 15-32 |
| $75,000+ | 22 | 19-24 | 63 | 57-69 | 14 | 10-19 |
| Race | ||||||
| White, non-Hispanic | 23 | 22-25 | 58 | 54-62 | 19 | 16-22 |
| Black, non-Hispanic | 26 | 21-31 | 46 | 34-58 | 20 | 12-32 |
| Hispanic | 32 | 23-41 | NSR | NSR | NSR | NSR |
*Excludes missing, don't know and refused
Note: If "NSR" is displayed, then the total response is less than 50 and/or the percentage prevalence is considered "not statistically reliable."
Provided Regular Care/Assistance to Friend/Family Member Who Has a Health Problem/Disability in the Past Month Prevalence per 1,000 Pennsylvania Population, Pennsylvania Adults, 2015-2019
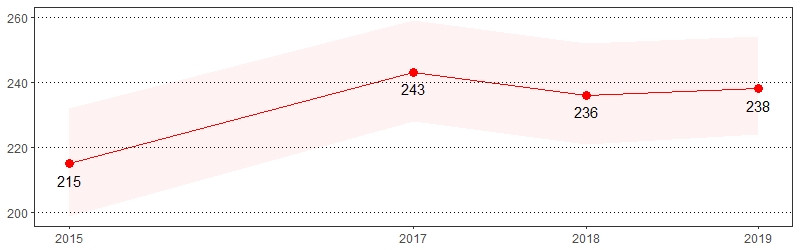
Color shading around estimates show 95% confidence intervals
High blood cholesterol is a major risk factor for coronary heart disease.10 The estimate(s) of adults who indicated they had their blood cholesterol checked in the past five years, were ever told they have high blood cholesterol or are currently taking medicine for high blood cholesterol are shown below.
Cholesterol Awareness, Pennsylvania Adults, 2019
| Blood Cholesterol Checked in the Past 5 Years* |
Ever Told Have High Blood Cholesterol* | Currently Taking Medicine for High Blood Cholesterol* | ||||
|---|---|---|---|---|---|---|
| Demographics | % | CI | % | CI | % | CI |
| All adults | 88 | 87-89 | 31 | 30-33 | 62 | 59-65 |
| Gender | ||||||
| Male | 85 | 83-87 | 32 | 30-34 | 65 | 61-69 |
| Female | 91 | 89-92 | 30 | 28-32 | 59 | 55-63 |
| Age | ||||||
| 18-29 | 73 | 69-77 | 10 | 8-14 | NSR | NSR |
| 30-44 | 81 | 77-84 | 16 | 13-18 | 23 | 16-31 |
| 45-64 | 93 | 91-94 | 39 | 36-41 | 61 | 57-65 |
| 65+ | 97 | 96-98 | 49 | 46-52 | 81 | 77-84 |
| Education | ||||||
| < High school | 80 | 73-86 | 34 | 28-41 | 68 | 56-79 |
| High school | 87 | 85-89 | 33 | 30-35 | 68 | 63-72 |
| Some college | 88 | 85-90 | 30 | 27-33 | 59 | 54-64 |
| College degree | 91 | 90-93 | 29 | 27-32 | 54 | 49-58 |
| Household income | ||||||
| < $15,000 | 85 | 80-89 | 34 | 28-40 | 75 | 65-83 |
| $15,000 to $24,999 | 87 | 83-90 | 33 | 29-37 | 65 | 57-72 |
| $25,000 to $49,999 | 88 | 85-91 | 33 | 30-36 | 69 | 64-74 |
| $50,000 to $74,999 | 90 | 87-92 | 29 | 25-32 | 65 | 58-71 |
| $75,000+ | 88 | 85-90 | 30 | 27-32 | 51 | 46-56 |
| Race | ||||||
| White, non-Hispanic | 88 | 87-89 | 33 | 31-34 | 64 | 61-67 |
| Black, non-Hispanic | 91 | 87-94 | 26 | 22-30 | 65 | 56-73 |
| Hispanic | 82 | 75-87 | 24 | 18-31 | NSR | NSR |
*Excludes missing, don't know and refused
Note: If "NSR" is displayed, then the total response is less than 50 and/or the percentage prevalence is considered "not statistically reliable."
Cholesterol Awareness Prevalence per 1,000 Pennsylvania Population,
Pennsylvania Adults, 2011-2019
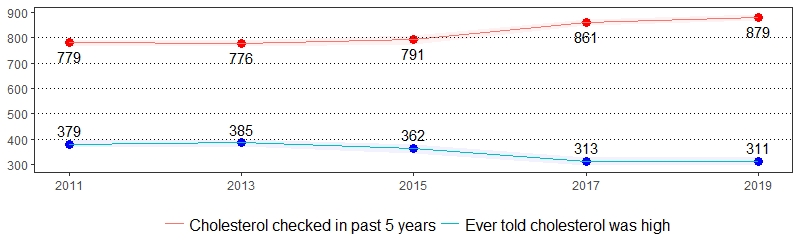
Color shading around estimates show 95% confidence intervals
Chronic obstructive pulmonary disease (COPD) is a progressive disease that usually results in coughing, wheezing, shortness of breath, chest tightness and other symptoms.11 The estimate(s) of adults who indicated they were ever told they have COPD, emphysema or chronic bronchitis are shown below.
Chronic Obstructive Pulmonary Disease (COPD), Pennsylvania Adults, 2019
| Ever Told They Have COPD, Emphysema or Chronic Bronchitis* | ||
|---|---|---|
| Demographics | % | CI |
| All adults | 7 | 6-8 |
| Gender | ||
| Male | 7 | 6-8 |
| Female | 8 | 7-9 |
| Age | ||
| 18-29 | 1 | 1-2 |
| 30-44 | 4 | 2-5 |
| 45-64 | 8 | 7-10 |
| 65+ | 14 | 12-16 |
| Education | ||
| < High school | 17 | 13-22 |
| High school | 8 | 7-10 |
| Some college | 6 | 5-8 |
| College degree | 3 | 2-4 |
| Household income | ||
| < $15,000 | 17 | 13-22 |
| $15,000 to $24,999 | 15 | 12-19 |
| $25,000 to $49,999 | 10 | 8-12 |
| $50,000 to $74,999 | 5 | 3-6 |
| $75,000+ | 2 | 2-3 |
| Race | ||
| White, non-Hispanic | 8 | 7-9 |
| Black, non-Hispanic | 8 | 5-11 |
| Hispanic | 2 | 1-4 |
*Excludes missing, don't know and refused
Chronic Obstructive Pulmonary Disease (COPD) Prevalence per 1,000 Pennsylvania Population, Pennsylvania Adults, 2011-2019
Color shading around estimates show 95% confidence intervals
Cognitive decline, ranging from mild cognitive impairment to dementia, can have profound implications for an individual's overall health and well-being. Older adults and others experiencing cognitive decline may be unable to care for themselves or conduct necessary activities of daily living, such as meal preparation and money management. Limitations with the ability to effectively manage medications and existing medical conditions are particular concerns when an individual is experiencing cognitive decline or dementia.12 The estimate(s) of adults age 45 and older who indicated they experienced more frequent or worsening confusion or memory loss in the past year, usually or always give up household activities or chores because of confusion or memory loss or usually or always need assistance with day to day activities as a result of confusion or memory loss are shown below.
Cognitive Decline, Pennsylvania Adults, Age 45+, 2019
| Experienced More Frequent or Worsening Confusion or Memory Loss in the Past Year* | Usually or Always Gives Up Household Activities or Chores Because of Confusion or Memory Loss* | Usually or Always Need Assistance With Day to Day Activities as a Result of Confusion or Memory Loss* | ||||
|---|---|---|---|---|---|---|
| Demographics | % | CI | % | CI | % | CI |
| All adults | 10 | 9-11 | 8 | 5-12 | 8 | 6-13 |
| Gender | ||||||
| Male | 9 | 8-11 | 6 | 3-12 | 8 | 4-14 |
| Female | 10 | 8-12 | 9 | 5-16 | 9 | 5-15 |
| Age | ||||||
| 45-64 | 10 | 8-11 | 11 | 7-18 | 10 | 6-16 |
| 65+ | 10 | 8-12 | 4 | 2-8 | 6 | 3-12 |
| Education | ||||||
| < High school | 18 | 12-26 | NSR | NSR | NSR | NSR |
| High school | 9 | 7-11 | 4 | 2-8 | 10 | 5-17 |
| Some college | 11 | 9-14 | 11 | 5-22 | 8 | 4-17 |
| College degree | 6 | 5-8 | 6 | 3-12 | 5 | 2-13 |
| Household income | ||||||
| < $15,000 | 27 | 19-37 | NSR | NSR | 8 | 3-18 |
| $15,000 to $24,999 | 16 | 12-20 | 10 | 5-21 | 9 | 4-21 |
| $25,000 to $49,999 | 8 | 6-11 | 6 | 2-14 | 8 | 3-19 |
| $50,000 to $74,999 | 8 | 5-11 | NSR | NSR | NSR | NSR |
| $75,000+ | 5 | 4-7 | 3 | 1-9 | 6 | 2-17 |
| Race | ||||||
| White, non-Hispanic | 9 | 8-10 | 8 | 5-12 | 7 | 5-12 |
| Black, non-Hispanic | 15 | 10-21 | NSR | NSR | NSR | NSR |
| Hispanic | NSR | NSR | NSR | NSR | NSR | NSR |
*Excludes missing, don't know and refused
Note: If "NSR" is displayed, then the total response is less than 50 and/or the percentage prevalence is considered "not statistically reliable."
Experienced More Frequent or Worsening Confusion or Memory Loss in the Past Year Prevalence per 1,000 Pennsylvania Population, Pennsylvania Adults, Age 45+, 2018-2019
Color shading around estimates show 95% confidence intervals
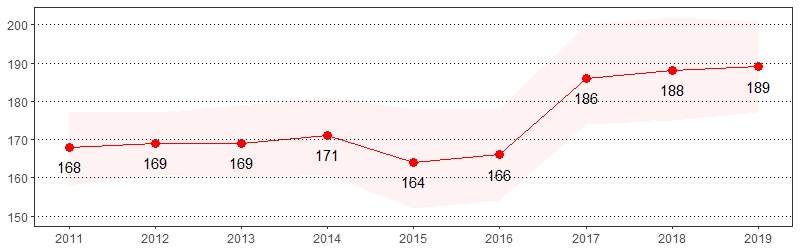
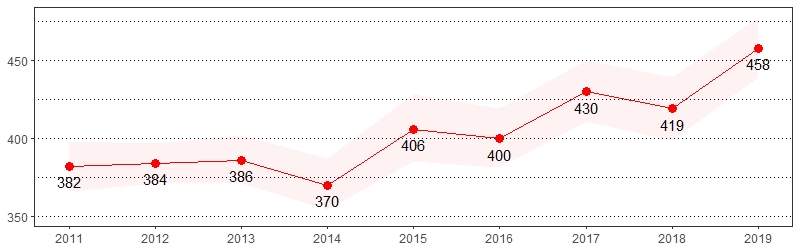
Depression is a common and treatable medical disorder that is more common among individuals with chronic conditions such as obesity, diabetes and arthritis.13 The estimate(s) of adults who indicated they were ever told they have a depressive disorder, including depression, major depression, minor depression or dysthymia are shown below.
Depression, Pennsylvania Adults, 2019
| Ever Told They Have Some Form of Depressive Disorder* | ||
|---|---|---|
| Demographics | % | CI |
| All adults | 20 | 18-21 |
| Gender | ||
| Male | 13 | 12-15 |
| Female | 26 | 24-28 |
| Age | ||
| 18-29 | 26 | 22-29 |
| 30-44 | 21 | 18-24 |
| 45-64 | 20 | 18-22 |
| 65+ | 14 | 12-16 |
| Education | ||
| < High school | 22 | 17-27 |
| High school | 19 | 17-21 |
| Some college | 23 | 20-26 |
| College degree | 17 | 15-19 |
| Household income | ||
| < $15,000 | 37 | 32-43 |
| $15,000 to $24,999 | 28 | 24-33 |
| $25,000 to $49,999 | 21 | 18-24 |
| $50,000 to $74,999 | 17 | 14-20 |
| $75,000+ | 14 | 12-16 |
| Race | ||
| White, non-Hispanic | 20 | 19-22 |
| Black, non-Hispanic | 19 | 15-23 |
| Hispanic | 21 | 16-27 |
*Excludes missing, don't know and refused
Depression Prevalence per 1,000 Pennsylvania Population,
Pennsylvania Adults, 2011-2019
Color shading around estimates show 95% confidence intervals
Diabetes is the seventh leading cause of death in the United States.7 The estimate(s) of adults who indicated they were ever told they have diabetes, check their blood sugar daily, are now taking insulin and saw a doctor four or more times in the past year for diabetes are shown below.
Diabetes, Pennsylvania Adults, 2019
| Ever Told Have Diabetes* | Now Taking Insulin* ** | Check Their Blood Sugar Daily* ** |
Saw Doctor 4+ Times in Past Year for Diabetes* ** |
|||||
|---|---|---|---|---|---|---|---|---|
| Demographics | % | CI | % | CI | % | CI | % | CI |
| All adults | 11 | 10-12 | 36 | 31-40 | 62 | 57-66 | 41 | 36-46 |
| Gender | ||||||||
| Male | 11 | 9-12 | 40 | 34-47 | 60 | 53-66 | 40 | 33-46 |
| Female | 11 | 10-12 | 32 | 26-39 | 63 | 57-70 | 42 | 35-49 |
| Age | ||||||||
| 18-29 | 2 | 1-3 | NSR | NSR | NSR | NSR | NSR | NSR |
| 30-44 | 4 | 3-5 | NSR | NSR | NSR | NSR | NSR | NSR |
| 45-64 | 13 | 12-15 | 36 | 29-43 | 59 | 51-66 | 42 | 35-50 |
| 65+ | 22 | 19-24 | 32 | 26-39 | 59 | 52-66 | 39 | 32-46 |
| Education | ||||||||
| < High school | 13 | 9-18 | NSR | NSR | NSR | NSR | NSR | NSR |
| High School | 12 | 10-14 | 31 | 25-38 | 60 | 52-67 | 43 | 35-51 |
| Some college | 12 | 10-14 | 38 | 30-47 | 67 | 58-75 | 46 | 37-55 |
| College degree | 8 | 7-9 | 36 | 29-44 | 54 | 46-62 | 29 | 22-38 |
| Household income | ||||||||
| < $15,000 | 17 | 13-22 | 33 | 21-47 | NSR | NSR | NSR | NSR |
| $15,000 to $24,999 | 17 | 14-21 | 38 | 28-49 | 55 | 42-67 | 42 | 31-53 |
| $25,000 to $49,999 | 12 | 10-15 | 33 | 24-43 | 67 | 57-76 | 35 | 25-45 |
| $50,000 to $74,999 | 11 | 9-13 | 36 | 26-47 | 61 | 50-71 | 35 | 25-46 |
| $75,000+ | 7 | 6-8 | 29 | 21-39 | 52 | 42-62 | 43 | 33-53 |
| Race | ||||||||
| White, non-Hispanic | 11 | 10-12 | 33 | 28-38 | 59 | 54-65 | 39 | 34-45 |
| Black, non-Hispanic | 16 | 13-20 | 38 | 27-50 | 67 | 54-78 | 46 | 34-59 |
| Hispanic | 6 | 3-10 | NSR | NSR | NSR | NSR | NSR | NSR |
*Excludes missing, don't know and refused
**Denominator is persons who have diabetes
Note: If "NSR" is displayed, then the total response is less than 50 and/or the percentage prevalence is considered "not statistically reliable."
Diabetes Prevalence per 1,000 Pennsylvania Population,
Pennsylvania Adults, 2011-2019
Color shading around estimates show 95% confidence intervals
Regular physical activity among adults has been shown to reduce the risk of many diseases including cardiovascular disease, diabetes, colon and breast cancers and osteoporosis. Keeping physically active also helps to control weight, maintain healthy bones, muscles, and joints, and relieve symptoms of depression.14 The estimate(s) of adults who indicated they met aerobic recommendations, met muscle strengthening recommendations, participated in no physical activity in the past month and participated in over 300 minutes of physical activity per week are shown below.
Exercise, Pennsylvania Adults, 2019
| Participated in No Physical Activity in the Past Month* ** | Met Muscle Strengthening Recommendation* | Met Aerobic Recommendation* | Participated in Over 300 Minutes of Physical Activity per Week* | |||||
|---|---|---|---|---|---|---|---|---|
| Demographics | % | CI | % | CI | % | CI | % | CI |
| All adults | 26 | 24-27 | 34 | 32-35 | 50 | 48-52 | 31 | 30-33 |
| Gender | ||||||||
| Male | 24 | 22-26 | 37 | 35-40 | 51 | 48-53 | 33 | 31-35 |
| Female | 27 | 25-29 | 30 | 28-32 | 49 | 47-52 | 29 | 27-32 |
| Age | ||||||||
| 18-29 | 18 | 15-21 | 43 | 39-47 | 50 | 45-54 | 28 | 24-32 |
| 30-44 | 22 | 19-25 | 35 | 32-39 | 49 | 46-53 | 29 | 26-33 |
| 45-64 | 28 | 26-31 | 30 | 28-32 | 48 | 46-51 | 29 | 27-31 |
| 65+ | 32 | 29-35 | 30 | 27-33 | 54 | 51-57 | 39 | 36-42 |
| Education | ||||||||
| < High school | 37 | 31-44 | 22 | 17-28 | 40 | 33-47 | 28 | 22-35 |
| High School | 33 | 30-35 | 30 | 27-33 | 46 | 43-49 | 30 | 27-33 |
| Some college | 24 | 22-27 | 36 | 33-39 | 50 | 47-53 | 31 | 28-34 |
| College degree | 13 | 12-15 | 40 | 38-42 | 59 | 57-61 | 34 | 32-37 |
| Household income | ||||||||
| < $15,000 | 40 | 34-46 | 32 | 27-38 | 35 | 30-41 | 26 | 21-32 |
| $15,000 to $24,999 | 40 | 36-45 | 29 | 24-33 | 41 | 36-45 | 27 | 24-32 |
| $25,000 to $49,999 | 31 | 28-35 | 29 | 26-33 | 46 | 42-49 | 31 | 27-34 |
| $50,000 to $74,999 | 20 | 17-23 | 33 | 29-37 | 56 | 52-61 | 33 | 29-37 |
| $75,000+ | 16 | 14-18 | 39 | 37-42 | 56 | 53-59 | 33 | 31-36 |
| Race | ||||||||
| White, non-Hispanic | 24 | 23-26 | 33 | 31-34 | 52 | 50-54 | 32 | 30-34 |
| Black, non-Hispanic | 31 | 26-35 | 35 | 30-40 | 43 | 38-48 | 28 | 23-33 |
| Hispanic | 32 | 26-39 | 39 | 32-47 | 43 | 36-51 | 26 | 20-34 |
*Excludes missing, don't know and refused
**Odd years of survey include the following interviewer instruction: If respondent does not have a "regular job duty" or is retired, they may count the physical activity or exercise they spend the most time doing in a regular month.
Participated in No Physical Activity Prevalence per 1,000 Pennsylvania Population,
Pennsylvania Adults, 2011-2019
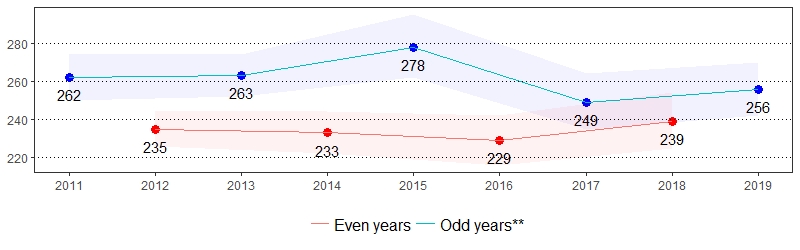
Color shading around estimates show 95% confidence intervals
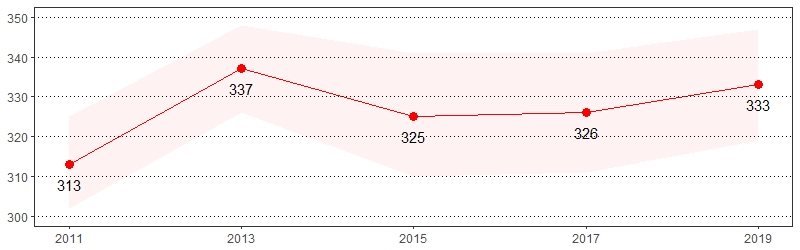
Preconception health refers to the health of women and men during their reproductive years, which are the years they can have a child. It focuses on taking steps now to protect the health of a baby they might have sometime in the future.15 The estimate(s) of women who indicated she or her husband/partner did something they last time they had sex to keep from getting pregnant are shown below.
Family Planning, Pennsylvania Women, Age 18-44, 2019
| She or Husband/Partner Did Something Last Time They Had Sex to Keep From Getting Pregnant* |
||
|---|---|---|
| Demographics | % | CI |
| Gender | ||
| Female | 58 | 54-63 |
| Age | ||
| 18-29 | 61 | 53-69 |
| 30-44 | 56 | 51-62 |
| Education | ||
| < High school | NSR | NSR |
| High school | 49 | 40-58 |
| Some college | 62 | 54-69 |
| College degree | 67 | 61-73 |
| Household income | ||
| < $15,000 | NSR | NSR |
| $15,000 to $24,999 | 60 | 47-71 |
| $25,000 to $49,999 | 59 | 49-69 |
| $50,000 to $74,999 | 58 | 44-70 |
| $75,000+ | 65 | 57-72 |
| Race | ||
| White, non-Hispanic | 62 | 56-67 |
| Black, non-Hispanic | 51 | 39-63 |
| Hispanic | NSR | NSR |
*Excludes missing, don't know and refused
Note: If "NSR" is displayed, then the total response is less than 50 and/or the percentage prevalence is considered "not statistically reliable."
She or Husband/Partner Did Something Last Time They Had Sex to Keep From Getting Pregnant Prevalence per 1,000 Pennsylvania Population, Pennsylvania Women, Age 18-44, 2012-2019
Color shading around estimates show 95% confidence intervals
Eating fruits and vegetables lowers the risk of developing many chronic diseases and can also help with weight management. Only 12.2 percent and 9.3 percent of adults meet the daily fruit and vegetable intake recommendations, respectively.16 The estimate(s) of adults who indicated they eat five or more fruits or vegetables daily, consume two or more fruits or 100% fruit juice daily or consume three or more vegetables or salads daily are shown below.
Fruits and Vegetables, Pennsylvania Adults, 2019
| Eat Five or More Fruits or Vegetables Daily* | Consume Two or More Fruits or 100% Fruit Juice Daily* | Consume Three or More Vegetables or Salads Daily* | ||||
|---|---|---|---|---|---|---|
| Demographics | % | CI | % | CI | % | CI |
| All adults | 10 | 9-11 | 29 | 28-31 | 8 | 7-8 |
| Gender | ||||||
| Male | 7 | 6-8 | 26 | 24-28 | 5 | 4-6 |
| Female | 13 | 12-15 | 32 | 30-34 | 10 | 9-11 |
| Age | ||||||
| 18-29 | 9 | 7-13 | 25 | 21-29 | 6 | 4-9 |
| 30-44 | 14 | 11-16 | 31 | 28-34 | 12 | 10-14 |
| 45-64 | 9 | 8-11 | 27 | 25-29 | 7 | 6-8 |
| 65+ | 9 | 7-11 | 33 | 31-36 | 6 | 4-7 |
| Education | ||||||
| < High school | 10 | 7-15 | 25 | 19-32 | 5 | 3-8 |
| High school | 7 | 6-9 | 26 | 23-28 | 4 | 3-5 |
| Some college | 9 | 7-11 | 28 | 25-31 | 7 | 6-9 |
| College degree | 15 | 14-17 | 36 | 34-38 | 13 | 11-15 |
| Household income | ||||||
| < $15,000 | 6 | 3-9 | 24 | 19-30 | 5 | 3-8 |
| $15,000 to $24,999 | 10 | 7-14 | 30 | 26-35 | 6 | 4-10 |
| $25,000 to $49,999 | 7 | 5-9 | 26 | 23-30 | 4 | 3-5 |
| $50,000 to $74,999 | 10 | 8-13 | 26 | 22-30 | 8 | 6-10 |
| $75,000+ | 12 | 11-14 | 32 | 29-34 | 11 | 10-13 |
| Race | ||||||
| White, non-Hispanic | 9 | 8-10 | 29 | 27-30 | 7 | 6-8 |
| Black, non-Hispanic | 12 | 9-15 | 31 | 26-36 | 7 | 5-10 |
| Hispanic | 16 | 10-24 | 33 | 26-41 | 8 | 5-12 |
*Excludes missing, don't know and refused
Consume Two or More Fruits or 100% Fruit Juice Daily
Prevalence per 1,000 Pennsylvania Population, Pennsylvania Adults, 2011-2019
Color shading around estimates show 95% confidence intervals
BRFSS respondents were asked to rate their general health as excellent, very good, good, fair or poor. The estimate(s) of adults who reported that their health was fair or poor are shown below.
General Health, Pennsylvania Adults, 2019
| Fair or Poor General Health* | ||
|---|---|---|
| Demographics | % | CI |
| All Adults | 19 | 18-20 |
| Gender | ||
| Male | 19 | 17-20 |
| Female | 19 | 18-21 |
| Age | ||
| 18-29 | 13 | 10-16 |
| 30-44 | 13 | 11-16 |
| 45-64 | 23 | 21-25 |
| 65+ | 24 | 22-27 |
| Education | ||
| < High school | 31 | 26-37 |
| High school | 22 | 20-24 |
| Some college | 20 | 17-22 |
| College degree | 9 | 8-11 |
| Household income | ||
| < $15,000 | 41 | 35-47 |
| $15,000 to $24,999 | 35 | 31-40 |
| $25,000 to $49,999 | 22 | 19-25 |
| $50,000 to $74,999 | 13 | 11-16 |
| $75,000+ | 9 | 7-10 |
| Race | ||
| White, non-Hispanic | 18 | 17-19 |
| Black, non-Hispanic | 24 | 20-29 |
| Hispanic | 20 | 16-26 |
*Excludes missing, don't know and refused
Fair or Poor General Health Prevalence per 1,000 Pennsylvania Population,
Pennsylvania Adults, 2011-2019
Color shading around estimates show 95% confidence intervals
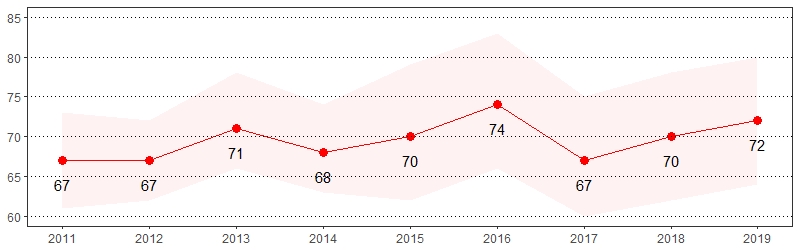
Two additional indicators related to health care access are: 1) not having a personal doctor or health care provider and 2) having had a time during the past 12 months when you needed to see a doctor but could not because of the cost. The estimate(s) of adults who indicated they have no personal health care provider, could not receive care in the past year due to cost or visited a doctor for a routine checkup in the past two years are shown below.
Health Care Access, Pennsylvania Adults, 2019
| Does Not Have a Personal Health Care Provider* | Couldn't Receive Care in the Past Year Due to Cost* |
Visited a Doctor for a Routine Checkup in the Past 2 Years* | ||||
|---|---|---|---|---|---|---|
| Demographics | % | CI | % | CI | % | CI |
| All adults | 16 | 15-17 | 10 | 9-11 | 89 | 88-90 |
| Gender | ||||||
| Male | 21 | 19-23 | 9 | 8-11 | 86 | 84-87 |
| Female | 12 | 10-14 | 11 | 9-12 | 93 | 92-94 |
| Age | ||||||
| 18-29 | 34 | 30-38 | 12 | 10-15 | 84 | 81-87 |
| 30-44 | 23 | 20-26 | 14 | 12-16 | 81 | 78-84 |
| 45-64 | 10 | 8-11 | 10 | 9-12 | 93 | 92-94 |
| 65+ | 5 | 4-6 | 4 | 3-5 | 98 | 97-98 |
| Education | ||||||
| < High school | 23 | 18-29 | 13 | 10-18 | 82 | 75-87 |
| High school | 18 | 16-20 | 11 | 9-12 | 90 | 88-92 |
| Some college | 15 | 13-17 | 12 | 10-14 | 91 | 89-92 |
| College degree | 13 | 12-15 | 6 | 5-7 | 90 | 88-91 |
| Household income | ||||||
| < $15,000 | 17 | 13-22 | 17 | 13-21 | 91 | 87-94 |
| $15,000 to $24,999 | 18 | 15-22 | 18 | 15-22 | 89 | 86-91 |
| $25,000 to $49,999 | 18 | 15-21 | 12 | 10-15 | 88 | 85-90 |
| $50,000 to $74,999 | 11 | 9-14 | 9 | 7-12 | 90 | 88-92 |
| $75,000+ | 15 | 13-17 | 5 | 4-7 | 89 | 87-91 |
| Race | ||||||
| White, non-Hispanic | 14 | 13-15 | 8 | 7-9 | 89 | 88-90 |
| Black, non-Hispanic | 17 | 14-21 | 14 | 11-18 | 94 | 91-96 |
| Hispanic | 32 | 26-40 | 23 | 18-30 | 88 | 82-92 |
*Excludes missing, don't know and refused
Health Care Access Prevalence per 1,000 Pennsylvania Population,
Pennsylvania Adults, 2011-2019
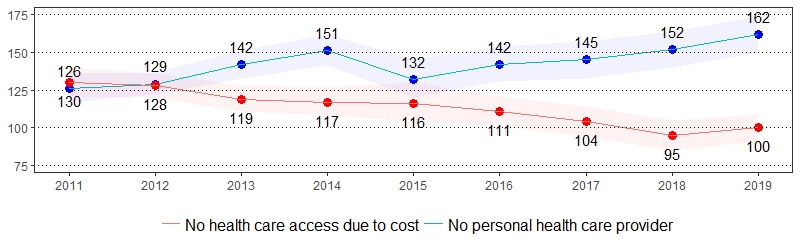
Color shading around estimates show 95% confidence intervals
Health care, or insurance coverage, includes private plans and plans such as Health Maintenance Organizations (HMOs) or governmental plans such as Medicare or the Indian Health Service. The estimate(s) of adults whose primary source of health care coverage is a plan purchased through an employer or union or are ages 18-64 who reported having no health care coverage are shown below.
Health Care Coverage, Pennsylvania Adults, 2019
| No Health Insurance, Age 18-64* | Primary Source of Health Care Coverage is Plan Purchased Through an Employer or Union* | |||
|---|---|---|---|---|
| Demographics | % | CI | % | CI |
| All adults | 10 | 9-12 | 50 | 48-52 |
| Gender | ||||
| Male | 12 | 11-14 | 51 | 49-54 |
| Female | 8 | 7-10 | 49 | 47-51 |
| Age | ||||
| 18-29 | 12 | 10-15 | 51 | 46-56 |
| 30-44 | 14 | 11-17 | 67 | 63-71 |
| 45-64 | 7 | 5-8 | 67 | 64-69 |
| 65+ | NSR | NSR | 13 | 11-15 |
| Education | ||||
| < High school | 27 | 20-35 | 22 | 16-30 |
| High school | 11 | 9-13 | 42 | 39-45 |
| Some college | 10 | 8-12 | 51 | 48-55 |
| College degree | 4 | 3-5 | 67 | 65-69 |
| Household income | ||||
| < $15,000 | 14 | 9-20 | 7 | 4-12 |
| $15,000 to $24,999 | 15 | 12-19 | 16 | 13-20 |
| $25,000 to $49,999 | 16 | 13-20 | 37 | 34-41 |
| $50,000 to $74,999 | 9 | 6-13 | 61 | 57-65 |
| $75,000+ | 5 | 4-7 | 76 | 73-78 |
| Race | ||||
| White, non-Hispanic | 8 | 7-10 | 52 | 50-53 |
| Black, non-Hispanic | 12 | 9-16 | 44 | 38-49 |
| Hispanic | 23 | 17-29 | 43 | 34-52 |
*Excludes missing, don't know and refused
Note: If "NSR" is displayed, then the total response is less than 50 and/or the percentage prevalence is considered "not statistically reliable."
No Health Insurance Prevalence per 1,000 Pennsylvania Population,
Pennsylvania Adults, Age 18-64, 2011-2019
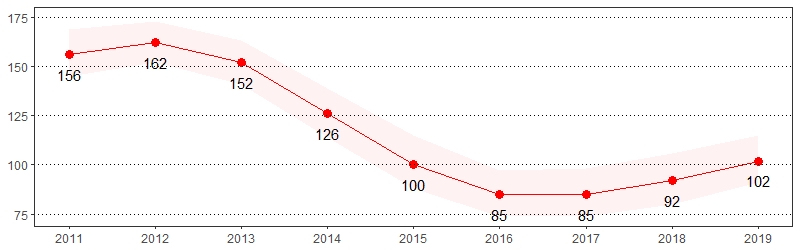
Color shading around estimates show 95% confidence intervals
Vision loss means that a person's eyesight is not corrected to a "normal" level. Vision loss can be caused by damage to the eye itself, by the eye being shaped incorrectly or even by a problem in the brain.17
Approximately 15 percent of American adults (37.5 million) report some trouble hearing.18 The estimate(s) of adults who indicated they were deaf or have serious difficulty hearing or were ever blind or have serious difficulty seeing, even when wearing glasses, are shown below.
Hearing and Vision Problem, Pennsylvania Adults, 2019
| Deaf or Serious Difficulty Hearing* | Blind or Serious Difficulty Seeing, Even With Glasses* |
|||
|---|---|---|---|---|
| Demographics | % | CI | % | CI |
| All adults | 6 | 5-7 | 4 | 3-5 |
| Gender | ||||
| Male | 7 | 6-8 | 3 | 2-4 |
| Female | 5 | 4-6 | 5 | 4-6 |
| Age | ||||
| 18-29 | 2 | 1-4 | 3 | 2-5 |
| 30-44 | 3 | 2-4 | 2 | 1-4 |
| 45-64 | 6 | 5-7 | 4 | 3-6 |
| 65+ | 14 | 12-16 | 6 | 5-8 |
| Education | ||||
| < High school | 8 | 5-12 | 9 | 6-13 |
| High school | 8 | 7-10 | 5 | 4-6 |
| Some college | 6 | 5-7 | 3 | 2-4 |
| College degree | 4 | 3-5 | 2 | 1-3 |
| Household income | ||||
| < $15,000 | 8 | 5-11 | 10 | 7-15 |
| $15,000 to $24,999 | 10 | 8-13 | 9 | 6-11 |
| $25,000 to $49,999 | 7 | 5-9 | 3 | 2-4 |
| $50,000 to $74,999 | 6 | 5-8 | 2 | 1-4 |
| $75,000+ | 3 | 2-4 | 2 | 1-3 |
| Race | ||||
| White, non-Hispanic | 7 | 6-8 | 3 | 3-4 |
| Black, non-Hispanic | 3 | 2-6 | 6 | 4-9 |
| Hispanic | 2 | 1-4 | 7 | 4-11 |
*Excludes missing, don't know and refused
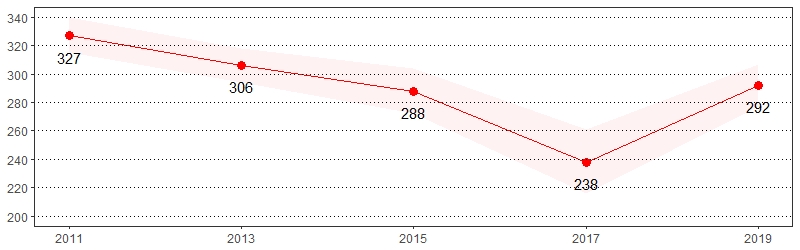
Vision Problem Prevalence per 1,000 Pennsylvania Population,
Pennsylvania Adults, 2013-2019
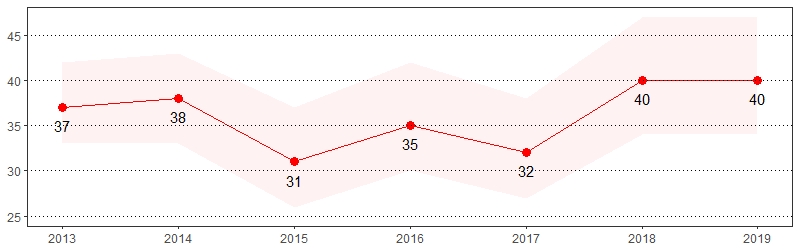
Color shading around estimates show 95% confidence intervals
Human Immunodeficiency Virus (HIV) is a virus spread through certain body fluids that attacks the body's immune system, specifically the CD4 cells, often called T cells.19 The estimate(s) of adults age 18-64 who indicated they were ever tested for HIV (except during a blood donation) or that an HIV situation applies to them are shown below.
HIV/AIDS, Pennsylvania Adults, Age 18-64, 2019
| Ever Tested for HIV, Except Blood Donation* |
Tested for HIV in the Past Year, Except Blood Donation* | HIV Situation Applies* ** | ||||
|---|---|---|---|---|---|---|
| Demographics | % | CI | % | CI | % | CI |
| All adults | 46 | 44-48 | 15 | 13-16 | 9 | 8-10 |
| Gender | ||||||
| Male | 42 | 39-45 | 13 | 11-15 | 10 | 9-12 |
| Female | 50 | 47-53 | 16 | 14-19 | 7 | 6-9 |
| Age | ||||||
| 18-29 | 38 | 34-43 | 19 | 16-23 | 18 | 15-22 |
| 30-44 | 59 | 55-63 | 20 | 17-23 | 9 | 7-11 |
| 45-64 | 41 | 38-43 | 8 | 7-10 | 3 | 2-4 |
| Education | ||||||
| < High school | 45 | 36-53 | 18 | 12-26 | 12 | 7-18 |
| High school | 45 | 41-48 | 15 | 12-18 | 9 | 7-11 |
| Some college | 46 | 42-50 | 16 | 13-19 | 10 | 8-13 |
| College degree | 47 | 44-50 | 13 | 11-15 | 6 | 5-8 |
| Household income | ||||||
| < $15,000 | 58 | 50-65 | 23 | 16-31 | 12 | 8-18 |
| $15,000 to $24,999 | 55 | 49-61 | 26 | 20-33 | 12 | 8-18 |
| $25,000 to $49,999 | 47 | 41-52 | 20 | 16-24 | 11 | 9-14 |
| $50,000 to $74,999 | 45 | 39-50 | 12 | 9-17 | 6 | 4-9 |
| $75,000+ | 44 | 41-47 | 10 | 8-13 | 7 | 5-9 |
| Race | ||||||
| White, non-Hispanic | 40 | 38-42 | 10 | 9-12 | 8 | 7-9 |
| Black, non-Hispanic | 75 | 70-80 | 42 | 35-50 | 13 | 10-18 |
| Hispanic | 60 | 51-67 | 23 | 17-31 | 14 | 10-20 |
*Excludes missing, don't know and refused
**Defined as having injected unprescribed drugs, having been treated for a sexually transmitted or venereal disease, having given or received money or drugs in exchange for sex, had anal sex without a condom or had four or more sex partners in the past year
Ever Tested for HIV, Except Blood Donation Prevalence per 1,000 Pennsylvania Population,
Pennsylvania Adults, Age 18-64, 2011-2019
Color shading around estimates show 95% confidence intervals
Adults with high blood pressure are at a higher risk for heart disease, stroke, congestive heart failure and end-stage renal disease.20 The estimate(s) of adults who reported they were ever told they have high blood pressure or are currently taking medicine for high blood pressure are shown below.
Hypertension Awareness, Pennsylvania Adults, 2019
| Ever Told Have High Blood Pressure* | Currently Taking Medicine for High Blood Pressure* |
|||
|---|---|---|---|---|
| Demographics | % | CI | % | CI |
| All adults | 33 | 32-35 | 81 | 78-83 |
| Gender | ||||
| Male | 35 | 33-37 | 76 | 73-79 |
| Female | 32 | 30-34 | 85 | 82-87 |
| Age | ||||
| 18-29 | 9 | 7-11 | 10 | 5-21 |
| 30-44 | 17 | 15-20 | 46 | 38-55 |
| 45-64 | 39 | 37-42 | 86 | 83-88 |
| 65+ | 61 | 58-64 | 93 | 92-95 |
| Education | ||||
| < High school | 36 | 30-42 | 81 | 72-88 |
| High school | 38 | 35-40 | 84 | 80-87 |
| Some college | 32 | 30-35 | 75 | 71-80 |
| College degree | 28 | 26-30 | 80 | 77-83 |
| Household income | ||||
| < $15,000 | 40 | 34-46 | 87 | 81-92 |
| $15,000 to $24,999 | 45 | 40-49 | 80 | 73-85 |
| $25,000 to $49,999 | 38 | 35-41 | 78 | 73-82 |
| $50,000 to $74,999 | 32 | 29-36 | 84 | 78-88 |
| $75,000+ | 26 | 23-28 | 78 | 74-82 |
| Race | ||||
| White, non-Hispanic | 34 | 33-36 | 81 | 78-83 |
| Black, non-Hispanic | 43 | 39-48 | 84 | 79-88 |
| Hispanic | 19 | 14-25 | NSR | NSR |
*Excludes missing, don't know and refused
Note: If "NSR" is displayed, then the total response is less than 50 and/or the percentage prevalence is considered "not statistically reliable."
Ever Told High Blood Pressure Prevalence per 1,000 Pennsylvania Population,
Pennsylvania Adults, 2011-2019
Color shading around estimates show 95% confidence intervals
Adult immunizations against influenza and pneumococcal disease are important health indicators that need to be routinely monitored.21 The estimate(s) of adults who indicated they had a flu shot or flu vaccine that was sprayed in the nose in the past year, did not have a tetanus shot in the past 10 years or are age 65 and older and ever had a pneumonia vaccination are shown below.
Immunization, Pennsylvania Adults, 2019
| Had Flu Shot or Flu Vaccine Sprayed in Nose in the Past Year* | Did Not Have a Tetanus Shot in the Past 10 Years* |
Ever Had Pneumonia Vaccination, Age 65+* | ||||
|---|---|---|---|---|---|---|
| Demographics | % | CI | % | CI | % | CI |
| All adults | 48 | 47-50 | 27 | 26-29 | 74 | 72-77 |
| Gender | ||||||
| Male | 42 | 40-45 | 26 | 24-28 | 73 | 69-76 |
| Female | 54 | 51-56 | 28 | 26-31 | 76 | 72-79 |
| Age | ||||||
| 18-29 | 38 | 34-42 | 21 | 17-25 | NSR | NSR |
| 30-44 | 35 | 32-38 | 24 | 21-28 | NSR | NSR |
| 45-64 | 47 | 45-50 | 27 | 25-30 | NSR | NSR |
| 65+ | 70 | 67-72 | 34 | 32-37 | 74 | 72-77 |
| Education | ||||||
| < High school | 39 | 32-46 | 36 | 29-43 | 67 | 54-78 |
| High school | 45 | 42-48 | 30 | 28-33 | 73 | 69-77 |
| Some college | 47 | 43-50 | 26 | 23-29 | 76 | 71-81 |
| College degree | 57 | 54-59 | 22 | 20-24 | 78 | 74-81 |
| Household income | ||||||
| < $15,000 | 44 | 38-51 | 38 | 32-44 | 70 | 59-79 |
| $15,000 to $24,999 | 50 | 45-55 | 35 | 30-40 | 70 | 62-76 |
| $25,000 to $49,999 | 47 | 43-50 | 29 | 25-32 | 75 | 70-80 |
| $50,000 to $74,999 | 47 | 43-51 | 25 | 22-29 | 77 | 70-83 |
| $75,000+ | 50 | 47-52 | 22 | 19-24 | 80 | 74-85 |
| Race | ||||||
| White, non-Hispanic | 49 | 48-51 | 25 | 23-27 | 75 | 72-78 |
| Black, non-Hispanic | 46 | 41-51 | 39 | 34-44 | 67 | 57-76 |
| Hispanic | 35 | 28-42 | 38 | 31-46 | NSR | NSR |
*Excludes missing, don't know and refused
Note: If "NSR" is displayed, then the total response is less than 50 and/or the percentage prevalence is considered "not statistically reliable."
Immunization Prevalence per 1,000 Pennsylvania Population,
Pennsylvania Adults, 2011-2019
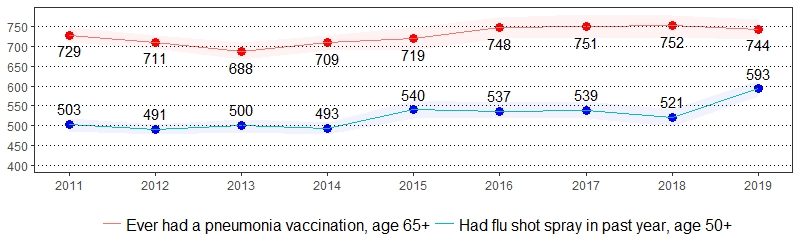
Color shading around estimates show 95% confidence intervals
Kidney disease is a condition in which the kidneys are damaged and are unable to filter blood properly. Adults with diabetes or hypertension are at an increased risk of kidney disease.22 The estimate(s) of adults who indicated they were ever told they have a kidney disease are shown below.
Kidney Disease, Pennsylvania Adults, 2019
| Ever Told Have Kidney Disease* | ||
|---|---|---|
| Demographics | % | CI |
| All adults | 3 | 3-4 |
| Gender | ||
| Male | 3 | 2-4 |
| Female | 3 | 2-4 |
| Age | ||
| 18-29 | 1 | 0-2 |
| 30-44 | 1 | 1-2 |
| 45-64 | 4 | 3-5 |
| 65+ | 6 | 5-7 |
| Education | ||
| < High school | 4 | 2-6 |
| High school | 3 | 2-4 |
| Some college | 4 | 3-5 |
| College degree | 2 | 2-3 |
| Household income | ||
| < $15,000 | 5 | 3-8 |
| $15,000 to $24,999 | 5 | 3-6 |
| $25,000 to $49,999 | 4 | 3-6 |
| $50,000 to $74,999 | 2 | 1-4 |
| $75,000+ | 2 | 1-3 |
| Race | ||
| White, non-Hispanic | 3 | 3-4 |
| Black, non-Hispanic | 4 | 3-7 |
| Hispanic | 2 | 1-5 |
*Excludes missing, don't know and refused
Kidney Disease Prevalence per 1,000 Pennsylvania Population,
Pennsylvania Adults, 2011-2019
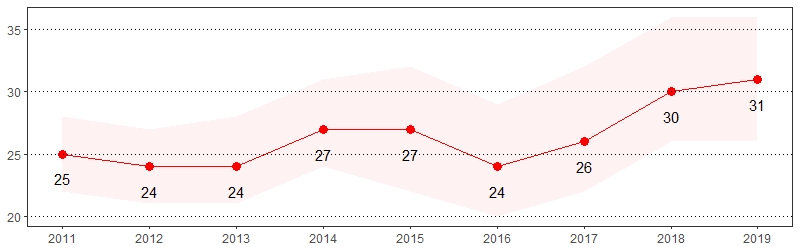
Color shading around estimates show 95% confidence intervals
One in 16 people in the United States will be diagnosed with lung cancer in their lifetime. More than 228,000 people in the United States will be diagnosed with lung cancer this year, with a new diagnosis every 2.3 minutes.23 The estimate(s) of adults started smoking cigarettes by age 20, smoked an average of 20 cigarettes each day or had a CT or CAT scan to check for lung cancer in the past year are shown below.
Lung Cancer Screening, Pennsylvania Adults, 2019
| Started Smoking Cigarettes by Age 20* |
Smoked an Average of 20 Cigarettes Each Day* | Had a CT or CAT Scan to Check for Lung Cancer in the Past Year* | ||||
|---|---|---|---|---|---|---|
| Demographics | % | CI | % | CI | % | CI |
| All adults | 83 | 81-85 | 29 | 27-31 | 4 | 3-4 |
| Gender | ||||||
| Male | 82 | 79-85 | 32 | 29-36 | 3 | 2-4 |
| Female | 83 | 80-86 | 25 | 22-29 | 4 | 3-5 |
| Age | ||||||
| 18-29 | 87 | 79-92 | 27 | 20-36 | 2 | 1-5 |
| 30-44 | 84 | 78-88 | 24 | 19-30 | 1 | 0-2 |
| 45-64 | 82 | 79-85 | 28 | 25-32 | 4 | 3-5 |
| 65+ | 81 | 77-85 | 35 | 31-39 | 7 | 5-9 |
| Education | ||||||
| < High school | 81 | 71-89 | 37 | 28-46 | 4 | 3-7 |
| High school | 85 | 81-87 | 30 | 26-34 | 4 | 3-6 |
| Some college | 82 | 78-85 | 26 | 22-30 | 4 | 3-6 |
| College degree | 81 | 77-84 | 26 | 23-31 | 2 | 1-2 |
| Household income | ||||||
| < $15,000 | 84 | 77-90 | 32 | 24-41 | 4 | 2-8 |
| $15,000 to $24,999 | 79 | 72-84 | 31 | 25-38 | 4 | 2-6 |
| $25,000 to $49,999 | 82 | 78-86 | 33 | 28-38 | 6 | 4-8 |
| $50,000 tot $74,999 | 83 | 77-88 | 30 | 24-37 | 3 | 2-5 |
| $75,000+ | 83 | 79-87 | 26 | 22-30 | 2 | 1-3 |
| Race | ||||||
| White, non-Hispanic | 83 | 81-85 | 31 | 28-34 | 4 | 3-4 |
| Black, non-Hispanic | 81 | 72-88 | 22 | 15-30 | 5 | 3-9 |
| Hispanic | 85 | 73-92 | NSR | NSR | 0 | 0-2 |
*Excludes missing, don't know and refused
Note: If "NSR" is displayed, then the total response is less than 50 and/or the percentage prevalence is considered "not statistically reliable."
Note: No trend available. These questions were first asked in 2019.
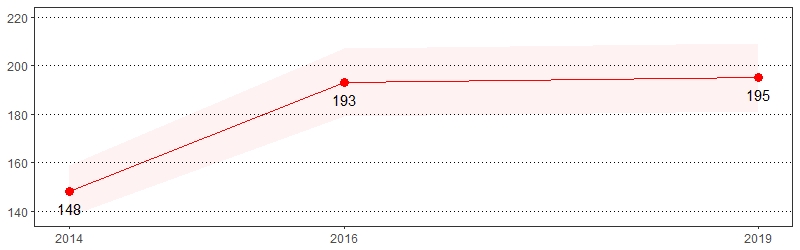
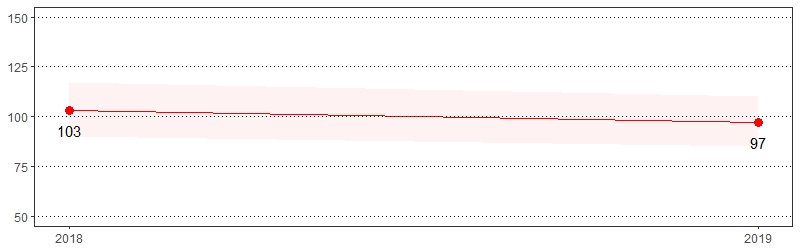
Each day, over 1,000 people are treated in emergency departments for misusing prescription opioids.24 The estimate(s) of adults who reported they used any prescription pain medications in the past year, used prescription pain medicines not prescribed to them in the past year or used non-prescription street drugs that were injected or snorted in the past year are shown below.
Illegal/Prescription Drug Use, Pennsylvania Adults, 2019
| Used Any Prescription Pain Medications in the Past Year* |
Used Prescription Pain Medicines Not Prescribed to Them in the Past Year* | Used Non-Prescription Street Drugs That Were Injected or Snorted in the Past Year* | ||||
|---|---|---|---|---|---|---|
| Demographics | % | CI | % | CI | % | CI |
| All adults | 27 | 25-28 | 7 | 5-9 | 2 | 1-2 |
| Gender | ||||||
| Male | 25 | 23-27 | 9 | 7-13 | 2 | 2-3 |
| Female | 28 | 26-31 | 5 | 3-7 | 1 | 1-2 |
| Age | ||||||
| 18-29 | 24 | 20-28 | 15 | 9-25 | 5 | 3-7 |
| 30-44 | 26 | 22-29 | 4 | 2-7 | 3 | 2-4 |
| 45-64 | 28 | 26-31 | 5 | 3-8 | 1 | 1-1 |
| 65+ | 29 | 26-32 | 7 | 5-10 | 0 | 0-0 |
| Education | ||||||
| < High school | 34 | 27-41 | 6 | 2-13 | 1 | 0-4 |
| High school | 27 | 24-30 | 8 | 5-12 | 2 | 1-3 |
| Some college | 30 | 27-33 | 7 | 4-11 | 2 | 1-4 |
| College degree | 21 | 19-23 | 6 | 4-9 | 1 | 1-2 |
| Household income | ||||||
| < $15,000 | 36 | 29-43 | 6 | 2-14 | 2 | 1-4 |
| $15,000 to $24,999 | 37 | 32-42 | 5 | 3-9 | 2 | 1-4 |
| $25,000 to $49,999 | 27 | 24-31 | 10 | 6-17 | 2 | 1-4 |
| $50,000 to $74,999 | 23 | 20-27 | 6 | 3-10 | 2 | 1-3 |
| $75,000+ | 22 | 20-25 | 7 | 5-12 | 1 | 1-2 |
| Race | ||||||
| White, non-Hispanic | 25 | 24-27 | 7 | 5-10 | 2 | 1-2 |
| Black, non-Hispanic | 38 | 33-44 | 5 | 2-10 | 1 | 1-3 |
| Hispanic | 28 | 21-36 | 12 | 6-24 | 4 | 2-8 |
*Excludes missing, don't know and refused
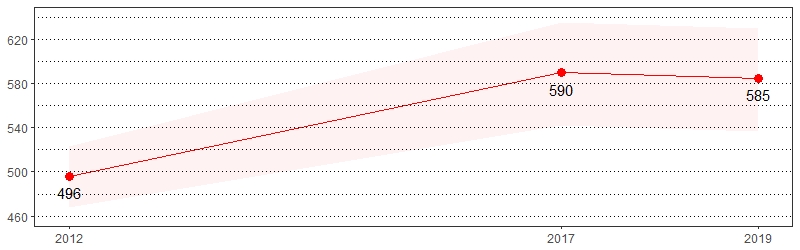
Used Any Prescription Paid Medications in the Past Year Prevalence per 1,000 Pennsylvania Population,
Pennsylvania Adults, 2017-2019
Color shading around estimates show 95% confidence intervals
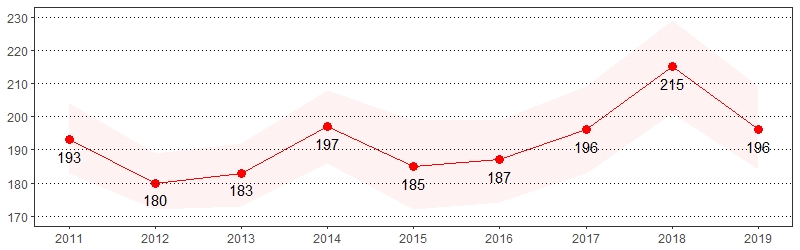
Being overweight or obese has been proven to increase the risk of many diseases and health conditions such as high blood pressure, diabetes, coronary heart disease, stroke, gallbladder disease, high cholesterol and some forms of cancer.25 The estimate(s) of adults who indicated they were overweight, obese or overweight and obese are shown below.
Overweight and Obese, Pennsylvania Adults, 2019
| Overweight* (BMI 25-29) |
Obese* (BMI >= 30) |
Overweight & Obese* (BMI >= 25) |
||||
|---|---|---|---|---|---|---|
| Demographics | % | CI | % | CI | % | CI |
| All adults | 35 | 34-37 | 33 | 32-35 | 68 | 67-70 |
| Gender | ||||||
| Male | 40 | 38-42 | 33 | 31-35 | 73 | 71-75 |
| Female | 31 | 28-33 | 33 | 31-35 | 64 | 61-66 |
| Age | ||||||
| 18-29 | 26 | 23-30 | 25 | 22-29 | 51 | 47-56 |
| 30-44 | 37 | 33-40 | 34 | 30-37 | 71 | 67-74 |
| 45-64 | 37 | 34-39 | 38 | 36-41 | 75 | 73-77 |
| 65+ | 39 | 36-42 | 32 | 29-35 | 71 | 68-73 |
| Education | ||||||
| < High school | 35 | 28-42 | 36 | 30-43 | 71 | 64-77 |
| High school | 35 | 33-38 | 36 | 33-38 | 71 | 68-73 |
| Some college | 34 | 31-37 | 35 | 32-38 | 69 | 66-72 |
| College degree | 37 | 34-39 | 27 | 25-29 | 64 | 62-66 |
| Household income | ||||||
| < $15,000 | 21 | 17-27 | 42 | 36-49 | 64 | 58-70 |
| $15,000 to $24,999 | 34 | 30-39 | 39 | 35-44 | 73 | 69-77 |
| $25,000 to $49,999 | 36 | 33-40 | 35 | 31-38 | 71 | 67-74 |
| $50,000 to $74,999 | 39 | 34-43 | 36 | 32-40 | 74 | 70-78 |
| $75,000+ | 37 | 35-40 | 29 | 27-32 | 67 | 64-69 |
| Race | ||||||
| White, non-Hispanic | 36 | 34-38 | 32 | 31-34 | 68 | 67-70 |
| Black, non-Hispanic | 33 | 28-38 | 44 | 39-50 | 78 | 73-81 |
| Hispanic | 33 | 26-40 | 33 | 26-40 | 66 | 58-73 |
*Excludes missing, don't know and refused
Note: The Body Mass Index (BMI), which describes relative weight for height, is significantly correlated with total body fat content. BMI is calculated as mass (kg)/height2 (m2) and estimated using pounds and inches by [weight (pound)/height2 (inches2)] x 703. Individuals with a BMI of 25 to 29.9 are considered overweight, while individuals with a BMI >= 30 are considered obese.
Overweight and Obese Prevalence per 1,000 Pennsylvania Population,
Pennsylvania Adults, 2011-2019
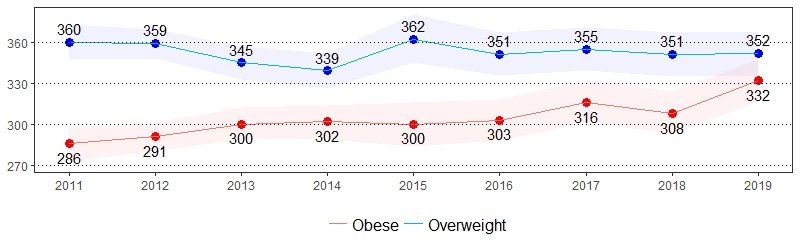
Color shading around estimates show 95% confidence intervals
Impairment is an absence of, or significant difference in, a person's body structure or function or mental functioning.26 One in 25 United States adults reported having difficulty dressing or bathing, and one in 15 United States adults reported having difficulty doing errands alone due to a health condition.27 The estimate(s) of adults who indicated they had difficulty making decisions due to a health condition, had difficulty walking or climbing stairs, had difficulty dressing or bathing, or had difficulty doing errands alone due to a health condition are shown below.
Physical Impairments, Pennsylvania Adults, 2019
| Have Difficulty Making Decisions Due to Health Condition* ** |
Have Difficulty Walking or Climbing Stairs* |
Have Difficulty Dressing or Bathing* | Have Difficulty Doing Errands Alone Due to Health Condition* ** |
|||||
|---|---|---|---|---|---|---|---|---|
| Demographics | % | CI | % | CI | % | CI | % | CI |
| All adults | 11 | 10-12 | 14 | 13-15 | 4 | 3-5 | 7 | 7-8 |
| Gender | ||||||||
| Male | 10 | 9-11 | 12 | 11-13 | 4 | 3-5 | 5 | 4-6 |
| Female | 13 | 11-14 | 15 | 14-17 | 4 | 3-5 | 9 | 8-11 |
| Age | ||||||||
| 18-29 | 15 | 13-19 | 2 | 1-3 | 1 | 0-2 | 7 | 5-10 |
| 30-44 | 11 | 9-13 | 6 | 4-7 | 2 | 2-4 | 5 | 3-6 |
| 45-64 | 12 | 10-14 | 17 | 16-20 | 6 | 5-7 | 8 | 7-10 |
| 65+ | 8 | 7-10 | 26 | 23-28 | 5 | 4-7 | 10 | 8-11 |
| Education | ||||||||
| < High school | 22 | 17-28 | 24 | 19-29 | 7 | 5-11 | 14 | 10-18 |
| High school | 12 | 10-14 | 17 | 15-19 | 5 | 4-6 | 8 | 7-10 |
| Some college | 13 | 11-15 | 12 | 11-14 | 4 | 3-5 | 8 | 6-10 |
| College degree | 6 | 5-7 | 7 | 6-8 | 2 | 2-3 | 3 | 3-4 |
| Household income | ||||||||
| < $15,000 | 31 | 25-37 | 33 | 28-39 | 15 | 11-20 | 22 | 17-27 |
| $15,000 to $24,999 | 22 | 19-26 | 27 | 23-31 | 8 | 6-11 | 16 | 13-20 |
| $25,000 to $49,999 | 12 | 10-15 | 14 | 12-17 | 3 | 2-4 | 6 | 5-8 |
| $50,000 to $74,999 | 6 | 4-9 | 10 | 8-13 | 3 | 2-5 | 4 | 3-5 |
| $75,000+ | 4 | 3-5 | 5 | 4-7 | 1 | 1-2 | 2 | 1-2 |
| Race | ||||||||
| White, non-Hispanic | 10 | 9-11 | 13 | 12-15 | 3 | 3-4 | 7 | 6-8 |
| Black, non-Hispanic | 15 | 12-19 | 18 | 15-22 | 7 | 5-10 | 10 | 8-13 |
| Hispanic | 14 | 9-19 | 9 | 6-14 | 5 | 3-10 | 8 | 5-13 |
*Excludes missing, don't know and refused
**Includes physical, mental or emotional problems
Physical Impairments Prevalence per 1,000 Pennsylvania Population,
Pennsylvania Adults, 2013-2019
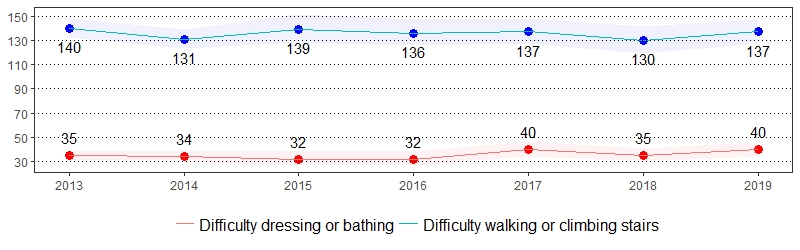
Color shading around estimates show 95% confidence intervals
Physically and mentally unhealthy days measure the number of days within the past 30 days that individuals rate their physical and mental health as not good. The estimate(s) of adults who reported one or more physically or mentally unhealthy days are shown below.
Quality of Life, Pennsylvania Adults, 2019
| Physical Health Not Good 1+ Days in the Past Month* |
Mental Health Not Good 1+ Days in the Past Month* |
|||
|---|---|---|---|---|
| Demographics | % | CI | % | CI |
| All adults | 39 | 37-40 | 38 | 37-40 |
| Gender | ||||
| Male | 36 | 34-38 | 32 | 30-34 |
| Female | 42 | 39-44 | 44 | 42-46 |
| Age | ||||
| 18-29 | 39 | 35-43 | 58 | 54-62 |
| 30-44 | 34 | 30-37 | 44 | 40-47 |
| 45-64 | 42 | 40-45 | 35 | 33-37 |
| 65+ | 39 | 36-41 | 23 | 20-25 |
| Education | ||||
| < High school | 43 | 37-50 | 40 | 34-47 |
| High school | 38 | 36-41 | 35 | 33-38 |
| Some college | 42 | 39-46 | 42 | 39-45 |
| College degree | 34 | 32-36 | 37 | 35-39 |
| Household income | ||||
| < $15,000 | 55 | 49-61 | 55 | 49-61 |
| $15,000 to $24,999 | 51 | 46-55 | 45 | 41-50 |
| $25,000 to $49,999 | 39 | 36-43 | 38 | 34-41 |
| $50,000 to $74,999 | 41 | 37-45 | 38 | 34-42 |
| $75,000+ | 30 | 28-32 | 35 | 32-37 |
| Race | ||||
| White, non-Hispanic | 39 | 37-40 | 37 | 36-39 |
| Black, non-Hispanic | 42 | 37-47 | 43 | 38-48 |
| Hispanic | 35 | 28-42 | 40 | 33-47 |
*Excludes missing, don't know and refused
Poor Physical and Mental Health Prevalence per 1,000 Pennsylvania Population,
Pennsylvania Adults, 2011-2019
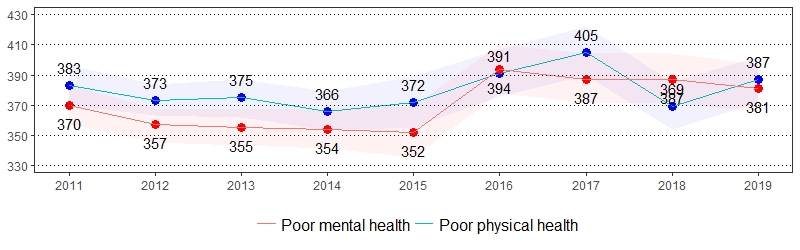
Color shading around estimates show 95% confidence intervals
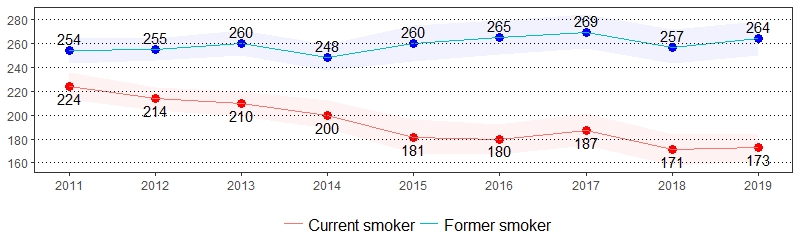
Cigarette smoking is the leading cause of preventable death in the United States, accounting for more than 480,000 deaths each year.28 Quitting smoking greatly reduces the risk of developing smoking-related diseases. Currently, there are more former smokers than current smokers in the United States.29 The estimate(s) of adults who indicated they are a current smoker, former smoker, have quit at least one day in the past year, or currently use chewing tobacco, snuff or snus are shown below.
Tobacco Use, Pennsylvania Adults, 2019
| Current Smoker* ** | Former Smoker* | Quit at Least 1 Day in the Past Year* ** |
Currently Use Chewing Tobacco, Snuff or Snus* *** |
|||||
|---|---|---|---|---|---|---|---|---|
| Demographics | % | CI | % | CI | % | CI | % | CI |
| All adults | 17 | 16-19 | 26 | 25-28 | 50 | 45-54 | 4 | 4-5 |
| Gender | ||||||||
| Male | 18 | 17-20 | 30 | 28-32 | 48 | 41-54 | 9 | 7-10 |
| Female | 16 | 15-18 | 23 | 21-25 | 52 | 45-58 | 1 | 0-1 |
| Age | ||||||||
| 18-29 | 15 | 13-19 | 9 | 7-12 | 62 | 50-73 | 6 | 5-8 |
| 30-44 | 22 | 19-25 | 24 | 21-27 | 48 | 39-57 | 6 | 4-8 |
| 45-64 | 20 | 18-22 | 28 | 26-31 | 42 | 36-49 | 4 | 3-6 |
| 65+ | 11 | 9-13 | 41 | 38-44 | 59 | 49-68 | 2 | 1-3 |
| Education | ||||||||
| < High school | 28 | 23-35 | 25 | 20-31 | NSR | NSR | 7 | 4-12 |
| High school | 22 | 20-24 | 29 | 26-31 | 49 | 42-55 | 6 | 4-7 |
| Some college | 18 | 16-20 | 28 | 25-30 | 49 | 41-56 | 4 | 3-5 |
| College degree | 7 | 6-8 | 23 | 21-25 | 50 | 40-61 | 3 | 2-4 |
| Household income | ||||||||
| < $15,000 | 29 | 24-34 | 25 | 20-31 | 60 | 48-70 | 5 | 2-10 |
| $15,000 to $24,999 | 29 | 25-33 | 25 | 21-29 | 47 | 38-57 | 5 | 3-8 |
| $25,000 to $49,999 | 22 | 19-25 | 28 | 25-32 | 48 | 40-57 | 5 | 3-7 |
| $50,000 to $74,999 | 15 | 12-18 | 28 | 25-32 | 48 | 35-61 | 4 | 2-5 |
| $75,000+ | 9 | 8-11 | 27 | 25-29 | 47 | 36-58 | 5 | 4-6 |
| Race | ||||||||
| White, non-Hispanic | 17 | 15-18 | 29 | 28-31 | 47 | 42-52 | 5 | 4-6 |
| Black, non-Hispanic | 21 | 17-25 | 19 | 15-23 | NSR | NSR | 2 | 1-4 |
| Hispanic | 18 | 13-25 | 13 | 9-18 | NSR | NSR | 3 | 1-5 |
*Excludes missing, don't know and refused
**Includes adults who smoke cigarettes every day or some days
***Includes adults who currently use chewing tobacco, snuff or snus every day or some days
Note: If "NSR" is displayed, then the total response is less than 50 and/or the percentage prevalence is considered "not statistically reliable."
Tobacco Use Prevalence per 1,000 Pennsylvania Population,
Pennsylvania Adults, 2011-2019