Tables and trend lines by topic
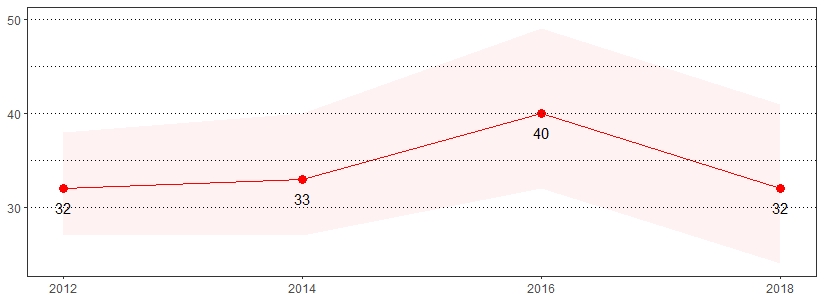
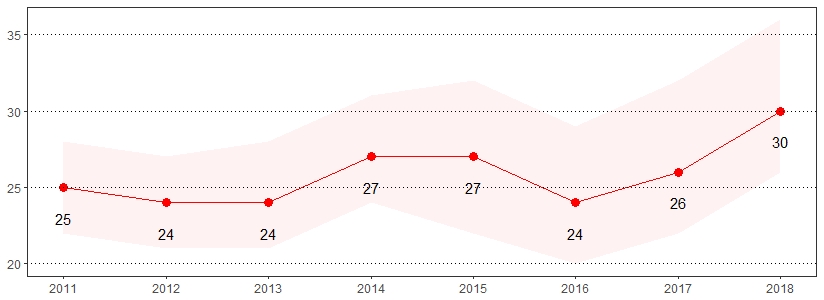
Excessive alcohol use contributes to approximately 88,000 deaths each year within the United States.1 The estimate(s) of adults who indicated binge drinking, chronic drinking or being at risk for problem drinking are shown below.
Alcohol Consumption, Pennsylvania Adults, 2018
| Binge Drinking* ** | At Risk for Problem Drinking* *** | Chronic Drinking* **** | ||||
|---|---|---|---|---|---|---|
| Demographics | % | CI | % | CI | % | CI |
| All adults | 17 | 16-18 | 6 | 6-7 | 6 | 5-7 |
| Gender | ||||||
| Male | 22 | 20-24 | 7 | 6-8 | 9 | 8-11 |
| Female | 12 | 11-14 | 6 | 5-7 | 3 | 2-4 |
| Age | ||||||
| 18-29 | 27 | 24-31 | 8 | 6-10 | 8 | 6-11 |
| 30-44 | 23 | 20-26 | 6 | 4-8 | 5 | 3-7 |
| 45-64 | 15 | 13-17 | 7 | 6-8 | 7 | 6-8 |
| 65+ | 6 | 4-7 | 4 | 3-6 | 5 | 4-6 |
| Education | ||||||
| < High school | 15 | 10-21 | 6 | 3-11 | 7 | 4-13 |
| High school | 16 | 14-18 | 6 | 5-7 | 6 | 5-7 |
| Some college | 18 | 15-20 | 7 | 5-8 | 7 | 5-9 |
| College degree | 19 | 17-21 | 7 | 6-8 | 5 | 4-6 |
| Household income | ||||||
| < $15,000 | 13 | 9-18 | 3 | 1-5 | 3 | 2-6 |
| $15,000 to $24,999 | 16 | 12-20 | 5 | 4-8 | 5 | 3-9 |
| $25,000 to $49,999 | 17 | 15-20 | 6 | 4-8 | 6 | 4-8 |
| $50,000 to $74,999 | 17 | 14-21 | 7 | 5-10 | 7 | 5-9 |
| $75,000+ | 22 | 19-24 | 8 | 7-10 | 8 | 6-9 |
| Race | ||||||
| White, non-Hispanic | 17 | 16-19 | 7 | 6-8 | 7 | 6-8 |
| Black, non-Hispanic | 16 | 12-20 | 4 | 3-6 | 3 | 2-5 |
| Hispanic | 23 | 17-30 | 4 | 2-8 | 6 | 2-13 |
| Sexual orientation | ||||||
| Lesbian, gay or bisexual | 31 | 23-40 | 13 | 8-20 | 9 | 5-16 |
| Straight | 16 | 15-18 | 6 | 5-7 | 6 | 5-7 |
*Excludes missing, don't know and refused
**Defined as having five or more drinks on one occasion for men and having four or more drinks on one occasion for women
***Defined as adult men having more than two drinks per day and adult women having more than one drink per day
****Defined as having an average of two drinks or more every day for the past 30 days
Alcohol Consumption Prevalence per 1,000 Pennsylvania Population,
Pennsylvania Adults, 2011-2018
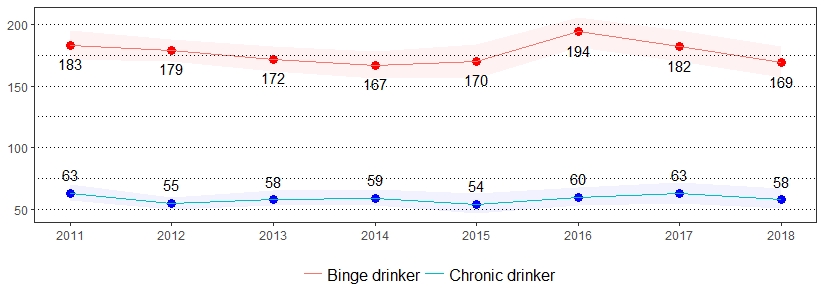
Color bands around estimates show 95% confidence intervals
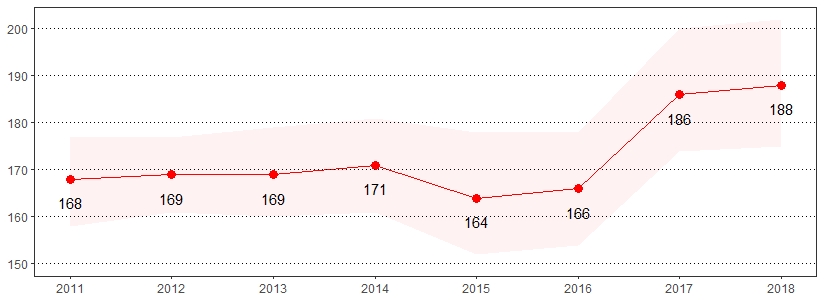
Arthritis and rheumatism are the leading causes of disability within the United States. Symptoms of arthritis include pain, aching, stiffness and swelling in or around the joints.2 The estimate(s) of adults who indicated they were ever told they have some form of arthritis, rheumatoid arthritis, gout, lupus or fibromyalgia are shown below.
Arthritis, Pennsylvania Adults, 2018
| Ever Told Have Some Form of Arthritis* | ||
|---|---|---|
| Demographics | % | CI |
| All adults | 29 | 27-30 |
| Gender | ||
| Male | 23 | 21-25 |
| Female | 34 | 32-36 |
| Age | ||
| 18-29 | 6 | 4-9 |
| 30-44 | 13 | 11-16 |
| 45-64 | 37 | 34-40 |
| 65+ | 53 | 49-56 |
| Education | ||
| < High school | 32 | 27-39 |
| High school | 32 | 29-35 |
| Some college | 30 | 27-33 |
| College degree | 22 | 20-24 |
| Household income | ||
| < $15,000 | 41 | 35-48 |
| $15,000 to $24,999 | 39 | 35-44 |
| $25,000 to $49,999 | 32 | 28-35 |
| $50,000 to $74,999 | 27 | 23-31 |
| $75,000+ | 21 | 19-23 |
| Race | ||
| White, non-Hispanic | 31 | 29-33 |
| Black, non-Hispanic | 28 | 24-33 |
| Hispanic | 18 | 13-26 |
| Sexual orientation | ||
| Lesbian, gay or bisexual | 24 | 16-32 |
| Straight | 30 | 29-32 |
*Excludes missing, don't know and refused
Arthritis Prevalence per 1,000 Pennsylvania Population,
Pennsylvania Adults, 2011-2018
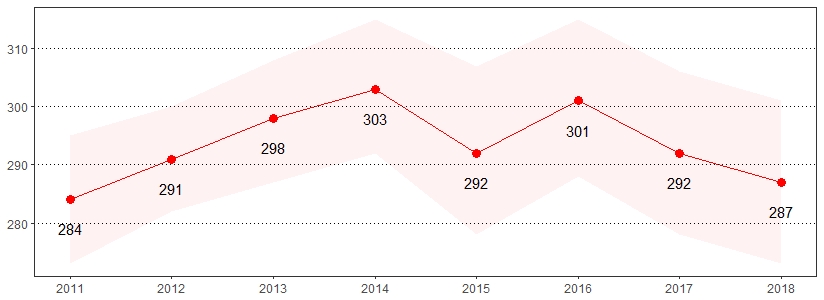
Color bands around estimates show 95% confidence intervals
Asthma is a chronic inflammatory disorder of the lungs, characterized by wheezing, coughing, difficulty breathing and chest tightness.3 The estimate(s) of adults who indicated they ever had asthma or currently have asthma are shown below.
Asthma, Pennsylvania Adults, 2018
| Ever Told Have Asthma* | Currently Has Asthma* | |||
|---|---|---|---|---|
| Demographics | % | CI | % | CI |
| All adults | 15 | 14-16 | 10 | 9-11 |
| Gender | ||||
| Male | 12 | 10-13 | 6 | 5-7 |
| Female | 18 | 16-20 | 14 | 12-16 |
| Age | ||||
| 18-29 | 20 | 17-24 | 9 | 7-12 |
| 30-44 | 16 | 14-19 | 10 | 8-13 |
| 45-64 | 14 | 12-16 | 11 | 10-13 |
| 65+ | 12 | 10-14 | 9 | 7-11 |
| Education | ||||
| < High school | 18 | 13-24 | 12 | 9-17 |
| High school | 14 | 12-16 | 10 | 8-12 |
| Some college | 16 | 14-19 | 11 | 9-13 |
| College degree | 15 | 13-16 | 8 | 7-10 |
| Household income | ||||
| < $15,000 | 22 | 17-29 | 17 | 12-22 |
| $15,000 to $24,999 | 21 | 17-25 | 15 | 12-19 |
| $25,000 to $49,999 | 14 | 12-17 | 10 | 8-12 |
| $50,000 to $74,999 | 13 | 10-16 | 10 | 7-12 |
| $75,000+ | 13 | 11-15 | 8 | 6-9 |
| Race | ||||
| White, non-Hispanic | 14 | 13-15 | 9 | 8-10 |
| Black, non-Hispanic | 19 | 15-23 | 15 | 12-19 |
| Hispanic | 24 | 17-31 | 12 | 8-18 |
| Sexual orientation | ||||
| Lesbian, gay or bisexual | 17 | 12-25 | 12 | 7-19 |
| Straight | 15 | 13-16 | 10 | 9-11 |
*Excludes missing, don't know and refused
Asthma Prevalence per 1,000 Pennsylvania Population,
Pennsylvania Adults, 2011-2018
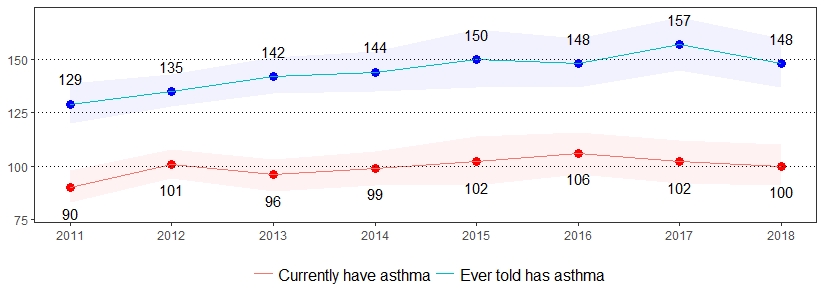
Color bands around estimates show 95% confidence intervals
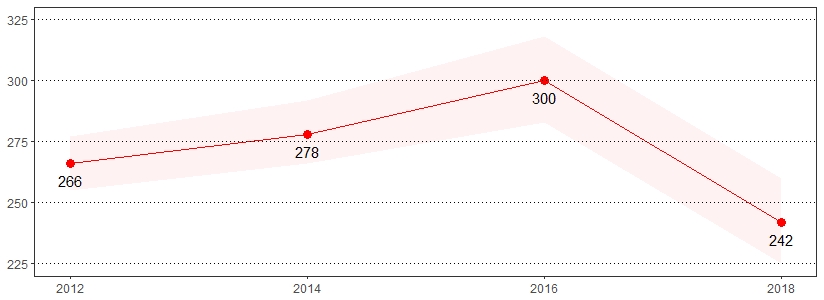
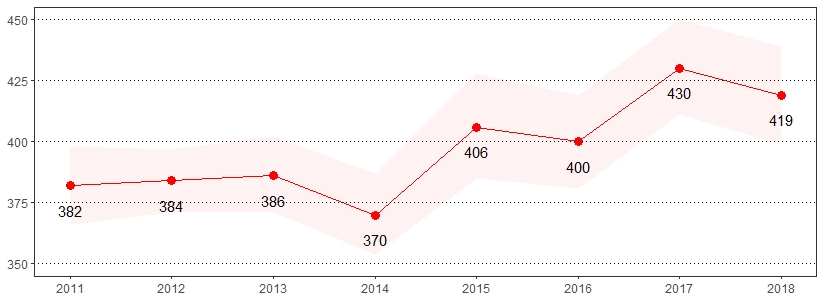
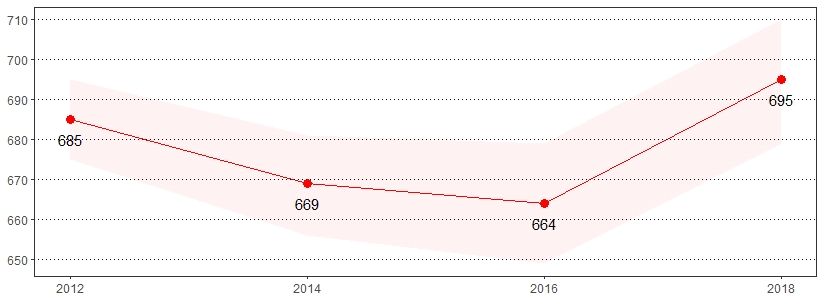
Breast cancer is the most common form of cancer and the second leading cause of cancer death among women.4 The estimate(s) of women age 40 and older who indicated they ever had a mammogram or had a mammogram in the past year are shown below.
Breast Cancer Screening, Pennsylvania Women, Age 40+, 2018
| Ever Had a Mammogram* | Had a Mammogram in the Past Year* | |||
|---|---|---|---|---|
| Demographics | % | CI | % | CI |
| Gender | ||||
| Female | 93 | 91-94 | 57 | 54-59 |
| Age | ||||
| 40-49 | 78 | 73-83 | 51 | 45-57 |
| 50-64 | 95 | 93-97 | 59 | 54-63 |
| 65-74 | 98 | 96-99 | 68 | 62-73 |
| 75+ | 97 | 93-98 | 45 | 39-52 |
| Education | ||||
| < High school | 91 | 82-96 | 45 | 33-57 |
| High school | 91 | 88-94 | 55 | 50-59 |
| Some college | 94 | 91-96 | 60 | 54-65 |
| College degree | 93 | 91-95 | 60 | 56-64 |
| Household income | ||||
| < $15,000 | 87 | 78-93 | 49 | 40-59 |
| $15,000 to $24,999 | 95 | 91-97 | 53 | 45-60 |
| $25,000 to $49,999 | 92 | 88-95 | 58 | 52-64 |
| $50,000 to $74,999 | 94 | 90-97 | 54 | 47-62 |
| $75,000+ | 92 | 88-94 | 58 | 53-63 |
| Race | ||||
| White, non-Hispanic | 93 | 91-95 | 56 | 53-59 |
| Black, non-Hispanic | 93 | 89-96 | 65 | 56-72 |
| Hispanic | NSR | NSR | NSR | NSR |
| Sexual orientation | ||||
| Lesbian, gay or bisexual | 99 | 95-100 | NSR | NSR |
| Straight | 93 | 91-94 | 56 | 53-59 |
*Excludes missing, don't know and refused
Note: If "NSR" is displayed, then the total response is less than 50 and/or the percentage prevalence is considered "not statistically reliable."
Had a Mammogram in the Past Year Prevalence per 1,000 Pennsylvania Population,
Pennsylvania Women, Age 40+, 2012-2018
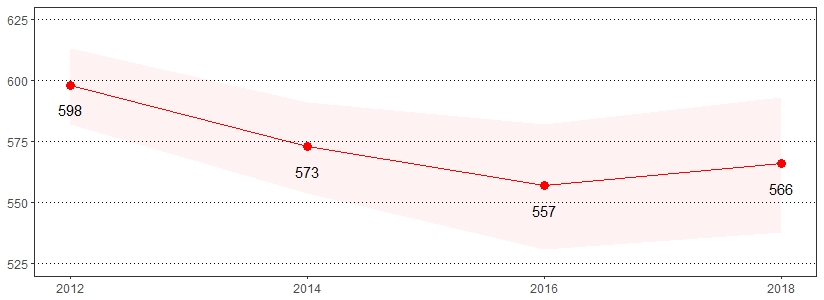
Color bands around estimates show 95% confidence intervals
Cancer is the second leading cause of death in the United States.5 The estimate(s) of adults who indicated they were ever told they had skin cancer and ever told they had any other type of cancer are shown below.
Cancer, Pennsylvania Adults, 2018
| Ever Told Had Skin Cancer* | Ever Told Had Any Other Type of Cancer* |
|||
|---|---|---|---|---|
| Demographics | % | CI | % | CI |
| All adults | 6 | 6-7 | 7 | 6-8 |
| Gender | ||||
| Male | 7 | 6-8 | 6 | 5-7 |
| Female | 6 | 5-7 | 8 | 7-9 |
| Age | ||||
| 18-29 | 1 | 0-4 | 1 | 0-3 |
| 30-44 | 1 | 1-2 | 3 | 2-4 |
| 45-64 | 7 | 5-8 | 7 | 6-9 |
| 65+ | 16 | 14-18 | 17 | 15-20 |
| Education | ||||
| < High school | 7 | 4-11 | 6 | 4-10 |
| High school | 5 | 4-7 | 7 | 6-9 |
| Some college | 6 | 5-8 | 8 | 6-9 |
| College degree | 7 | 6-8 | 7 | 6-8 |
| Household income | ||||
| < $15,000 | 5 | 3-9 | 6 | 4-9 |
| $15,000 to $24,999 | 7 | 5-11 | 9 | 7-13 |
| $25,000 to $49,999 | 7 | 5-9 | 9 | 7-11 |
| $50,000 to $74,999 | 6 | 4-8 | 6 | 4-8 |
| $75,000+ | 6 | 5-7 | 6 | 5-7 |
| Race | ||||
| White, non-Hispanic | 8 | 7-9 | 8 | 7-9 |
| Black, non-Hispanic | 0 | 0-0 | 8 | 5-11 |
| Hispanic | 3 | 1-10 | 5 | 2-11 |
| Sexual orientation | ||||
| Lesbian, gay or bisexual | 4 | 2-8 | 6 | 3-10 |
| Straight | 7 | 6-8 | 8 | 7-8 |
*Excludes missing, don't know and refused
Cancer Prevalence per 1,000 Pennsylvania Population,
Pennsylvania Adults, 2011-2018
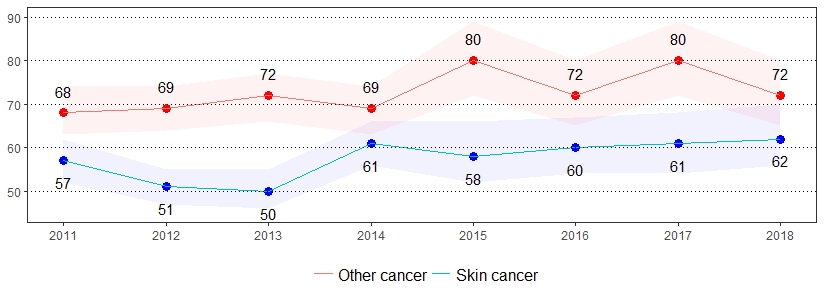
Color bands around estimates show 95% confidence intervals
Cardiovascular disease is the leading cause of death for men and women in the United States.6 The estimate(s) of adults age 35 and older who indicated they had a heart attack, heart disease or stroke, ever had a heart attack, ever had angina or heart disease, or ever had a stroke are shown below.
Cardiovascular Disease, Pennsylvania Adults, Age 35+, 2018
| Ever Told Had Heart Attack, Heart Disease or Stroke* | Ever Told They Had a Heart Attack* | Ever Told They Had Angina or Heart Disease* | Ever Told They Had a Stroke* | |||||
|---|---|---|---|---|---|---|---|---|
| Demographics | % | CI | % | CI | % | CI | % | CI |
| All adults | 13 | 12-14 | 6 | 5-7 | 6 | 5-7 | 5 | 4-6 |
| Gender | ||||||||
| Male | 15 | 13-17 | 8 | 7-9 | 8 | 7-10 | 5 | 4-6 |
| Female | 11 | 9-12 | 4 | 3-5 | 5 | 4-6 | 5 | 4-7 |
| Age | ||||||||
| 35-44 | 4 | 2-6 | 1 | 1-3 | 1 | 0-2 | 2 | 1-4 |
| 45-54 | 6 | 4-8 | 2 | 1-3 | 2 | 1-4 | 3 | 2-5 |
| 55-64 | 12 | 10-14 | 6 | 5-8 | 6 | 4-7 | 5 | 4-7 |
| 65+ | 24 | 21-27 | 11 | 9-13 | 13 | 11-15 | 9 | 7-11 |
| Education | ||||||||
| < High school | 23 | 18-30 | 11 | 7-16 | 11 | 8-17 | 12 | 8-16 |
| High school | 15 | 13-17 | 7 | 6-9 | 7 | 5-8 | 6 | 5-8 |
| Some college | 12 | 10-14 | 6 | 5-8 | 6 | 5-8 | 4 | 3-6 |
| College degree | 7 | 6-8 | 3 | 2-4 | 4 | 3-5 | 2 | 2-3 |
| Household income | ||||||||
| < $15,000 | 21 | 16-28 | 8 | 5-11 | 8 | 5-12 | 12 | 8-18 |
| $15,000 to $24,999 | 24 | 19-28 | 11 | 8-16 | 11 | 8-15 | 11 | 8-14 |
| $25,000 to $49,999 | 15 | 13-19 | 7 | 5-10 | 7 | 5-10 | 6 | 4-8 |
| $50,000 to $74,999 | 9 | 7-13 | 5 | 3-7 | 6 | 4-9 | 2 | 1-3 |
| $75,000+ | 6 | 4-7 | 3 | 2-4 | 4 | 3-5 | 1 | 1-2 |
| Race | ||||||||
| White, non-Hispanic | 13 | 11-14 | 6 | 5-7 | 7 | 6-8 | 4 | 4-5 |
| Black, non-Hispanic | 15 | 12-20 | 6 | 4-9 | 5 | 3-9 | 8 | 6-12 |
| Hispanic | 12 | 7-19 | 7 | 4-14 | 4 | 2-8 | 6 | 3-13 |
| Sexual orientation | ||||||||
| Lesbian, gay or bisexual | 12 | 6-22 | 9 | 4-19 | 4 | 2-9 | 6 | 3-15 |
| Straight | 12 | 11-14 | 6 | 5-7 | 6 | 5-7 | 5 | 4-6 |
*Excludes missing, don't know and refused
Cardiovascular Disease Prevalence per 1,000 Pennsylvania Population,
Pennsylvania Adults, Age 35+, 2011-2018
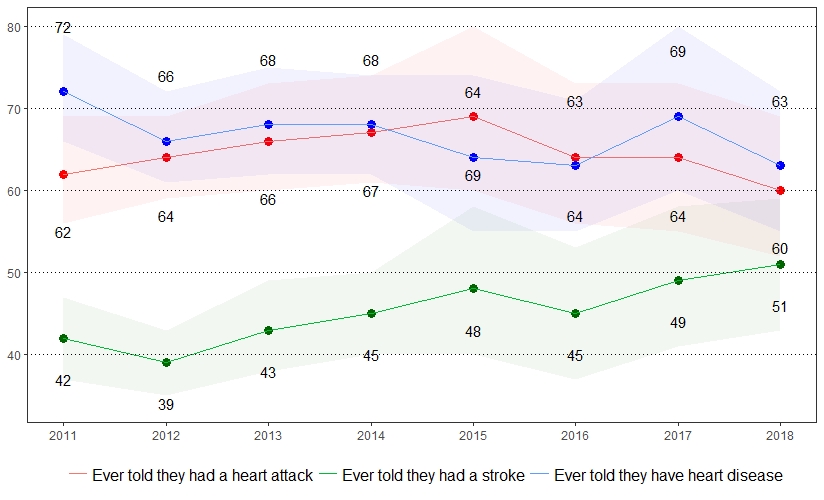
Color bands around estimates show 95% confidence intervals
Approximately 39.8 million caregivers, or 16.6 percent, provide care to adults with a disability or illness.7 The estimate(s) of adults who indicated they provided regular care or assistance to a friend or family member who has a health problem or disability in the past month, averaged up to eight hours per week in the past month providing care or assistance to a friend or family member who has a health problem or disability or averaged 40 hours or more per week in the past month providing care or assistance to a friend or family member who has a health problem or disability are shown below.
Caregiver, Pennsylvania Adults, 2018
| Provided Regular Care/Assistance to Friend/Family Member Who Has Health Problem/Disability in the Past Month* | Averaged Up to 8 Hours/Week in the Past Month Providing Care/Assistance to Friend/Family Member Who Has Health Problem/Disability* | Averaged 40 Hours or More per Week in the Past Month Providing Care/Assistance to Friend/Family Member Who Has Health Problem/Disability* | ||||
|---|---|---|---|---|---|---|
| Demographics | % | CI | % | CI | % | CI |
| All adults | 24 | 22-25 | 57 | 53-61 | 20 | 18-24 |
| Gender | ||||||
| Male | 18 | 16-20 | 62 | 56-67 | 16 | 12-20 |
| Female | 29 | 26-31 | 54 | 49-59 | 23 | 19-27 |
| Age | ||||||
| 18-29 | 17 | 13-21 | 50 | 37-62 | 17 | 10-27 |
| 30-44 | 20 | 17-24 | 59 | 50-68 | 24 | 17-33 |
| 45-64 | 30 | 27-32 | 58 | 52-63 | 20 | 16-25 |
| 65+ | 24 | 21-27 | 57 | 50-64 | 20 | 15-26 |
| Education | ||||||
| < High school | 18 | 13-25 | NSR | NSR | NSR | NSR |
| High school | 25 | 22-28 | 52 | 45-58 | 25 | 20-30 |
| Some college | 25 | 23-29 | 60 | 53-66 | 19 | 14-25 |
| College degree | 22 | 20-25 | 61 | 56-67 | 16 | 12-21 |
| Household income | ||||||
| < $15,000 | 19 | 13-26 | NSR | NSR | NSR | NSR |
| $15,000 to $24,999 | 26 | 22-31 | 45 | 35-55 | 29 | 21-38 |
| $25,000 to $49,999 | 25 | 22-29 | 47 | 39-55 | 21 | 16-28 |
| $50,000 to $74,999 | 24 | 20-29 | 67 | 57-75 | 13 | 8-20 |
| $75,000+ | 22 | 20-25 | 66 | 60-72 | 17 | 12-23 |
| Race | ||||||
| White, non-Hispanic | 24 | 22-26 | 60 | 56-64 | 19 | 16-22 |
| Black, non-Hispanic | 25 | 20-31 | 42 | 30-55 | 29 | 19-43 |
| Hispanic | 15 | 9-22 | NSR | NSR | NSR | NSR |
| Sexual orientation | ||||||
| Lesbian, gay or bisexual | 26 | 19-34 | NSR | NSR | NSR | NSR |
| Straight | 24 | 22-25 | 58 | 55-62 | 19 | 16-23 |
*Excludes missing, don't know and refused
Note: If "NSR" is displayed, then the total response is less than 50 and/or the percentage prevalence is considered "not statistically reliable."
Provided Regular Care/Assistance to Friend/Family Member Who Has a Health Problem/Disability in the Past Month Prevalence per 1,000 Pennsylvania Population, Pennsylvania Adults, 2015-2018
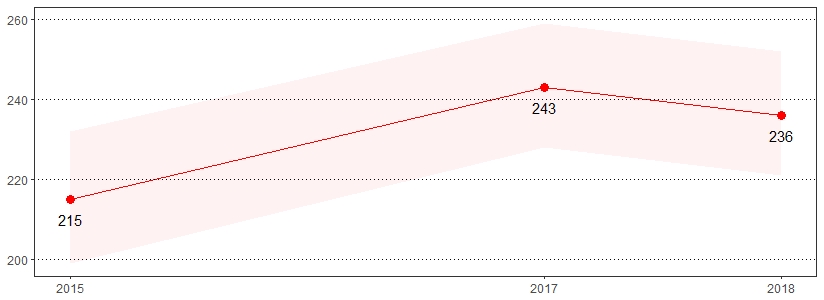
Color bands around estimates show 95% confidence intervals
Cognitive decline, ranging from mild cognitive impairment to dementia, can have profound implications for an individual's overall health and well-being. Older adults and others experiencing cognitive decline may be unable to care for themselves or conduct necessary activities of daily living, such as meal preparation and money management. Limitations with the ability to effectively manage medications and existing medical conditions are particular concerns when an individual is experiencing cognitive decline or dementia.8 The estimate(s) of adults age 45 and older who indicated they experienced more frequent or worsening confusion or memory loss in the past year, usually or always give up household activities or chores because of confusion or memory loss or usually or always need assistance with day to day activities as a result of confusion or memory loss are shown below.
Cognitive Decline, Pennsylvania Adults, Age 45+, 2018
| Experienced More Frequent or Worsening Confusion or Memory Loss in the Past Year* | Usually or Always Gives Up Household Activities or Chores Because of Confusion or Memory Loss* | Usually or Always Need Assistance With Day to Day Activities as a Result of Confusion or Memory Loss* | ||||
|---|---|---|---|---|---|---|
| Demographics | % | CI | % | CI | % | CI |
| All adults | 10 | 9-12 | 15 | 11-20 | 13 | 9-18 |
| Gender | ||||||
| Male | 11 | 9-13 | 12 | 7-20 | 11 | 6-18 |
| Female | 10 | 8-12 | 17 | 11-25 | 15 | 10-22 |
| Age | ||||||
| 45-64 | 10 | 9-12 | 19 | 13-26 | 16 | 11-23 |
| 65+ | 10 | 8-12 | 8 | 4-17 | 9 | 4-16 |
| Education | ||||||
| < High school | 17 | 12-24 | NSR | NSR | NSR | NSR |
| High school | 12 | 10-15 | 15 | 9-23 | 14 | 8-22 |
| Some college | 8 | 6-10 | 12 | 6-25 | NSR | NSR |
| College degree | 8 | 6-10 | 4 | 1-9 | 4 | 1-9 |
| Household income | ||||||
| < $15,000 | 22 | 16-30 | NSR | NSR | NSR | NSR |
| $15,000 to $24,999 | 20 | 15-26 | 17 | 9-29 | 15 | 8-25 |
| $25,000 to $49,999 | 10 | 7-13 | 11 | 5-23 | 7 | 3-18 |
| $50,000 to $74,999 | 6 | 4-9 | NSR | NSR | NSR | NSR |
| $75,000+ | 6 | 5-8 | NSR | NSR | NSR | NSR |
| Race | ||||||
| White, non-Hispanic | 10 | 8-11 | 11 | 8-17 | 10 | 6-15 |
| Black, non-Hispanic | 15 | 10-21 | NSR | NSR | NSR | NSR |
| Hispanic | NSR | NSR | NSR | NSR | NSR | NSR |
| Sexual orientation | ||||||
| Lesbian, gay or bisexual | NSR | NSR | NSR | NSR | NSR | NSR |
| Straight | 10 | 8-11 | 16 | 12-22 | 14 | 10-20 |
*Excludes missing, don't know and refused
Note: If "NSR" is displayed, then the total response is less than 50 and/or the percentage prevalence is considered "not statistically reliable."
Note: No trend available. These questions were first asked in 2018.
Approximately, one in 21 men (4.7 percent) and one in 23 women (4.4 percent) will develop colorectal cancer in their lifetime. Colorectal cancer is the third leading cause of cancer-related deaths in women and second leading cause of cancer-related deaths in men.9 Colonoscopy and sigmoidoscopy both use a thin flexible tube with a camera at the end to look at the colon. Colonoscopy examines the entire colon, while sigmoidoscopy is a partial exam that only covers the left side of the colon.10 The estimate(s) of adults age 50 and older who indicated they had a blood stool test in the past year, ever had a sigmoidoscopy or colonoscopy, or had a sigmoidoscopy or colonoscopy in the past 10 years are shown below.
Colorectal Cancer Screening, Pennsylvania Adults, Age 50+, 2018
| Had a Blood Stool Test in the Past Year* | Ever Had a Sigmoidoscopy or Colonoscopy* | Had a Sigmoidoscopy or Colonoscopy in the Past 10 Years* | ||||
|---|---|---|---|---|---|---|
| Demographics | % | CI | % | CI | % | CI |
| All adults | 10 | 8-11 | 71 | 69-73 | 66 | 64-68 |
| Gender | ||||||
| Male | 8 | 7-10 | 71 | 68-74 | 66 | 63-69 |
| Female | 11 | 9-13 | 72 | 69-75 | 66 | 62-69 |
| Age | ||||||
| 50-64 | 8 | 6-10 | 68 | 65-71 | 64 | 61-67 |
| 65-74 | 12 | 10-15 | 79 | 75-83 | 73 | 69-77 |
| 75+ | 11 | 8-15 | 69 | 64-74 | 59 | 54-65 |
| Education | ||||||
| < High school | 10 | 5-17 | 53 | 44-62 | 49 | 40-58 |
| High school | 10 | 8-13 | 70 | 66-73 | 64 | 60-67 |
| Some college | 10 | 7-12 | 74 | 70-78 | 68 | 64-72 |
| College degree | 9 | 7-11 | 79 | 76-82 | 74 | 71-77 |
| Household income | ||||||
| < $15,000 | 12 | 7-20 | 68 | 60-76 | 60 | 51-68 |
| $15,000 to $24,999 | 12 | 9-16 | 63 | 57-69 | 56 | 50-62 |
| $25,000 to $49,999 | 10 | 8-13 | 71 | 66-76 | 65 | 60-70 |
| $50,000 to $74,999 | 12 | 8-18 | 75 | 68-80 | 70 | 63-75 |
| $75,000+ | 6 | 5-8 | 76 | 72-79 | 71 | 67-74 |
| Race | ||||||
| White, non-Hispanic | 9 | 8-11 | 73 | 71-75 | 67 | 65-69 |
| Black, non-Hispanic | 11 | 7-17 | 67 | 60-74 | 63 | 55-70 |
| Hispanic | 10 | 4-22 | NSR | NSR | NSR | NSR |
| Sexual orientation | ||||||
| Lesbian, gay or bisexual | NSR | NSR | NSR | NSR | NSR | NSR |
| Straight | 9 | 8-11 | 73 | 70-75 | 67 | 64-69 |
*Excludes missing, don't know and refused
Note: If "NSR" is displayed, then the total response is less than 50 and/or the percentage prevalence is considered "not statistically reliable."
Ever Had a Sigmoidoscopy or Colonoscopy Prevalence per 1,000 Pennsylvania Population,
Pennsylvania Adults, Age 50+, 2012-2018
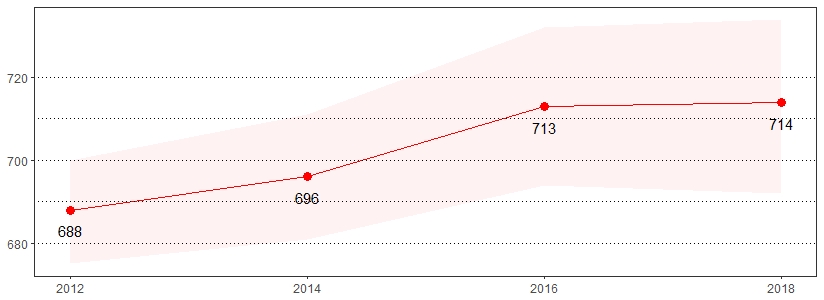
Color bands around estimates show 95% confidence intervals
Chronic obstructive pulmonary disease (COPD) is a progressive disease that usually results in coughing, wheezing, shortness of breath, chest tightness and other symptoms.11 The estimate(s) of adults who indicated they were ever told they have COPD, emphysema or chronic bronchitis are shown below.
Chronic Obstructive Pulmonary Disease (COPD), Pennsylvania Adults, 2018
| Ever Told They Have COPD, Emphysema or Chronic Bronchitis* | ||
|---|---|---|
| Demographics | % | CI |
| All adults | 7 | 6-8 |
| Gender | ||
| Male | 7 | 5-8 |
| Female | 7 | 6-9 |
| Age | ||
| 18-29 | 2 | 1-4 |
| 30-44 | 3 | 2-5 |
| 45-64 | 9 | 7-10 |
| 65+ | 14 | 12-16 |
| Education | ||
| < High school | 14 | 10-19 |
| High school | 8 | 7-10 |
| Some college | 7 | 6-8 |
| College degree | 3 | 3-4 |
| Household income | ||
| < $15,000 | 16 | 12-21 |
| $15,000 to $24,999 | 14 | 11-17 |
| $25,000 to $49,999 | 9 | 7-11 |
| $50,000 to $74,999 | 5 | 3-7 |
| $75,000+ | 3 | 2-4 |
| Race | ||
| White, non-Hispanic | 7 | 6-8 |
| Black, non-Hispanic | 7 | 5-10 |
| Hispanic | 8 | 4-16 |
| Sexual orientation | ||
| Lesbian, gay or bisexual | 4 | 2-8 |
| Straight | 7 | 6-8 |
*Excludes missing, don't know and refused
Chronic Obstructive Pulmonary Disease (COPD) Prevalence per 1,000 Pennsylvania Population, Pennsylvania Adults, 2011-2018
Color bands around estimates show 95% confidence intervals
Depression is a common and treatable medical disorder that is more common among individuals with chronic conditions such as obesity, diabetes and arthritis.12 The estimate(s) of adults who indicated they were ever told they have a depressive disorder, including depression, major depression, minor depression or dysthymia are shown below.
Depression, Pennsylvania Adults, 2018
| Ever Told They Have Some Form of Depressive Disorder* | ||
|---|---|---|
| Demographics | % | CI |
| All adults | 21 | 20-23 |
| Gender | ||
| Male | 15 | 14-17 |
| Female | 27 | 25-29 |
| Age | ||
| 18-29 | 25 | 21-29 |
| 30-44 | 26 | 23-29 |
| 45-64 | 21 | 19-24 |
| 65+ | 15 | 13-18 |
| Education | ||
| < High school | 28 | 22-35 |
| High school | 22 | 20-25 |
| Some college | 23 | 21-26 |
| College degree | 17 | 15-19 |
| Household income | ||
| < $15,000 | 44 | 37-51 |
| $15,000 to $24,999 | 32 | 27-36 |
| $25,000 to $49,999 | 24 | 21-28 |
| $50,000 to $74,999 | 18 | 15-22 |
| $75,000+ | 14 | 12-16 |
| Race | ||
| White, non-Hispanic | 21 | 20-23 |
| Black, non-Hispanic | 24 | 19-28 |
| Hispanic | 24 | 18-31 |
| Sexual orientation | ||
| Lesbian, gay or bisexual | 47 | 38-56 |
| Straight | 21 | 20-23 |
*Excludes missing, don't know and refused
Depression Prevalence per 1,000 Pennsylvania Population,
Pennsylvania Adults, 2011-2018
Color bands around estimates show 95% confidence intervals
Diabetes is the seventh leading cause of death in the United States.5 The estimate(s) of adults who indicated they were ever told they have diabetes are shown below.
Diabetes, Pennsylvania Adults, 2018
| Ever Told Have Diabetes* | ||
|---|---|---|
| Demographics | % | CI |
| All adults | 11 | 10-12 |
| Gender | ||
| Male | 11 | 10-13 |
| Female | 11 | 10-13 |
| Age | ||
| 18-29 | 3 | 1-5 |
| 30-44 | 5 | 4-7 |
| 45-64 | 14 | 12-16 |
| 65+ | 22 | 19-24 |
| Education | ||
| < High school | 19 | 15-25 |
| High School | 12 | 11-14 |
| Some college | 10 | 9-12 |
| College degree | 8 | 7-9 |
| Household income | ||
| < $15,000 | 20 | 16-26 |
| $15,000 to $24,999 | 19 | 15-22 |
| $25,000 to $49,999 | 11 | 9-13 |
| $50,000 to $74,999 | 11 | 8-14 |
| $75,000+ | 7 | 6-8 |
| Race | ||
| White, non-Hispanic | 11 | 10-12 |
| Black, non-Hispanic | 16 | 13-20 |
| Hispanic | 12 | 7-18 |
| Sexual orientation | ||
| Lesbian, gay or bisexual | 8 | 4-13 |
| Straight | 12 | 10-13 |
*Excludes missing, don't know and refused
Diabetes Prevalence per 1,000 Pennsylvania Population,
Pennsylvania Adults, 2011-2018
Color bands around estimates show 95% confidence intervals
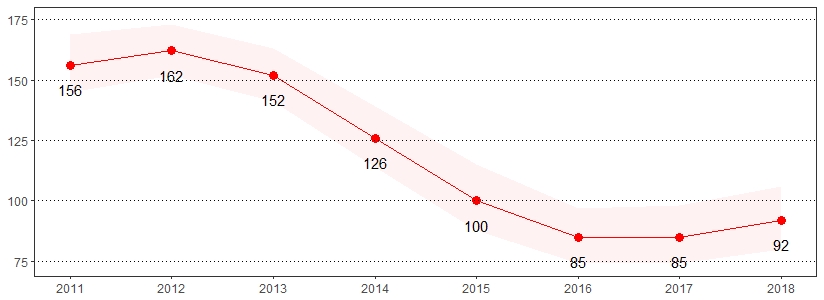
In 2017, 10,874 people were killed in alcohol-impaired driving crashes, accounting for nearly one-third (29 percent) of all traffic-related deaths in the United States.13 The estimate(s) of adults who indicated they have driven in the past month with perhaps too much to drink are shown below.
Drinking and Driving, Pennsylvania Adults, 2018
| Driven in the Past Month With Perhaps Too Much to Drink* | ||
|---|---|---|
| Demographics | % | CI |
| All adults | 3 | 2-4 |
| Gender | ||
| Male | 4 | 3-5 |
| Female | 2 | 1-4 |
| Age | ||
| 18-29 | 7 | 4-11 |
| 30-44 | 2 | 1-3 |
| 45-64 | 2 | 2-4 |
| 65+ | 2 | 1-4 |
| Education | ||
| < High school | 4 | 1-14 |
| High school | 3 | 2-4 |
| Some college | 5 | 3-8 |
| College degree | 2 | 2-3 |
| Household income | ||
| < $15,000 | 1 | 0-3 |
| $15,000 to $24,999 | 7 | 4-14 |
| $25,000 to $49,999 | 2 | 1-5 |
| $50,000 to $74,999 | 5 | 3-9 |
| $75,000+ | 3 | 2-4 |
| Race | ||
| White, non-Hispanic | 3 | 2-4 |
| Black, non-Hispanic | 4 | 2-9 |
| Hispanic | 5 | 2-15 |
| Sexual orientation | ||
| Lesbian, gay or bisexual | NSR | NSR |
| Straight | 3 | 2-4 |
*Excludes missing, don't know and refused
Note: If "NSR" is displayed, then the total response is less than 50 and/or the percentage prevalence is considered "not statistically reliable."
Have Driven in the Past Month With Perhaps Too Much to Drink
Prevalence per 1,000 Pennsylvania Population, Pennsylvania Adults, 2012-2018
Color bands around estimates show 95% confidence intervals
Regular physical activity among adults has been shown to reduce the risk of many diseases including cardiovascular disease, diabetes, colon and breast cancers and osteoporosis. Keeping physically active also helps to control weight, maintain healthy bones, muscles, and joints, and relieve symptoms of depression.14 The estimate(s) of adults who indicated they participated in no physical activity in the past month are shown below.
Exercise, Pennsylvania Adults, 2018
| Participated in No Physical Activity in the Past Month* ** | ||
|---|---|---|
| Demographics | % | CI |
| All adults | 24 | 22-25 |
| Gender | ||
| Male | 21 | 19-23 |
| Female | 27 | 25-29 |
| Age | ||
| 18-29 | 18 | 15-22 |
| 30-44 | 21 | 18-24 |
| 45-64 | 24 | 22-27 |
| 65+ | 32 | 29-35 |
| Education | ||
| < High school | 45 | 39-53 |
| High School | 30 | 27-32 |
| Some college | 21 | 19-24 |
| College degree | 11 | 10-13 |
| Household income | ||
| < $15,000 | 42 | 36-49 |
| $15,000 to $24,999 | 38 | 34-43 |
| $25,000 to $49,999 | 29 | 26-33 |
| $50,000 to $74,999 | 23 | 19-28 |
| $75,000+ | 12 | 10-14 |
| Race | ||
| White, non-Hispanic | 23 | 21-25 |
| Black, non-Hispanic | 29 | 24-33 |
| Hispanic | 31 | 24-39 |
| Sexual orientation | ||
| Lesbian, gay or bisexual | 24 | 17-33 |
| Straight | 23 | 21-25 |
*Excludes missing, don't know and refused
**Odd years of survey include the following interviewer instruction: If respondent does not have a "regular job duty" or is retired, they may count the physical activity or exercise they spend the most time doing in a regular month.
Participated in No Physical Activity Prevalence per 1,000 Pennsylvania Population,
Pennsylvania Adults, 2011-2018
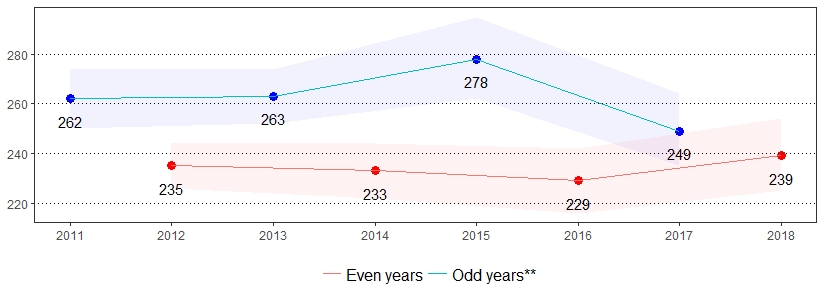
Color bands around estimates show 95% confidence intervals
Falls are the leading cause of fatal and non-fatal injuries for older Americans.15 The estimate(s) of adults age 45 and older who indicated they have fallen in the past 12 months or have been injured by a fall in the past 12 months are shown below.
Falls, Pennsylvania Adults, Age 45+, 2018
| Have Fallen in the Past 12 Months* | Have Been Injured by a Fall in the Past 12 Months* ** |
|||
|---|---|---|---|---|
| Demographics | % | CI | % | CI |
| All adults | 24 | 23-26 | 9 | 8-10 |
| Gender | ||||
| Male | 24 | 21-26 | 7 | 6-9 |
| Female | 25 | 22-27 | 11 | 9-13 |
| Age | ||||
| 45-64 | 24 | 22-26 | 9 | 8-11 |
| 65+ | 25 | 22-27 | 9 | 8-11 |
| Education | ||||
| < High school | 31 | 25-39 | 14 | 10-20 |
| High school | 26 | 23-29 | 10 | 8-13 |
| Some college | 21 | 18-24 | 7 | 6-10 |
| College degree | 22 | 20-25 | 7 | 5-8 |
| Household income | ||||
| < $15,000 | 40 | 32-48 | 23 | 17-31 |
| $15,000 to $24,999 | 30 | 25-35 | 13 | 10-18 |
| $25,000 to $49,999 | 28 | 24-32 | 10 | 7-13 |
| $50,000 to $74,999 | 23 | 19-28 | 7 | 5-11 |
| $75,000+ | 17 | 15-20 | 4 | 3-6 |
| Race | ||||
| White, non-Hispanic | 25 | 23-27 | 9 | 8-11 |
| Black, non-Hispanic | 20 | 15-25 | 10 | 7-15 |
| Hispanic | 20 | 11-32 | 2 | 1-5 |
| Sexual orientation | ||||
| Lesbian, gay or bisexual | NSR | NSR | NSR | NSR |
| Straight | 24 | 22-26 | 9 | 8-10 |
*Excludes missing, don't know and refused
**A fall that limited regular activities for at least 1 day or required a trip to go see a doctor
Note: If "NSR" is displayed, then the total response is less than 50 and/or the percentage prevalence is considered "not statistically reliable."
Have Fallen in the Past 12 Months Prevalence per 1,000 Pennsylvania Population,
Pennsylvania Adults, Age 45+, 2012-2018
Color bands around estimates show 95% confidence intervals
BRFSS respondents were asked to rate their general health as excellent, very good, good, fair or poor. The estimate(s) of adults who reported that their health was fair or poor are shown below.
General Health, Pennsylvania Adults, 2018
| Fair or Poor General Health* | ||
|---|---|---|
| Demographics | % | CI |
| All Adults | 19 | 18-20 |
| Gender | ||
| Male | 18 | 16-20 |
| Female | 20 | 18-21 |
| Age | ||
| 18-29 | 13 | 10-16 |
| 30-44 | 14 | 12-17 |
| 45-64 | 21 | 19-23 |
| 65+ | 26 | 23-29 |
| Education | ||
| < High school | 38 | 31-45 |
| High school | 23 | 21-26 |
| Some college | 16 | 14-18 |
| College degree | 9 | 8-11 |
| Household income | ||
| < $15,000 | 43 | 37-49 |
| $15,000 to $24,999 | 37 | 33-42 |
| $25,000 to $49,999 | 19 | 16-22 |
| $50,000 to $74,999 | 14 | 11-17 |
| $75,000+ | 8 | 6-10 |
| Race | ||
| White, non-Hispanic | 18 | 16-19 |
| Black, non-Hispanic | 25 | 21-29 |
| Hispanic | 25 | 19-32 |
| Sexual orientation | ||
| Lesbian, gay or bisexual | 23 | 17-31 |
| Straight | 18 | 17-20 |
*Excludes missing, don't know and refused
Fair or Poor General Health Prevalence per 1,000 Pennsylvania Population,
Pennsylvania Adults, 2011-2018
Color bands around estimates show 95% confidence intervals
Nearly 60 percent of American adults have not practiced what to do in a disaster by participating in a disaster drill or preparedness exercise at work, school, or home in the past year.16 The estimate(s) of adults who indicated their household is not prepared at all to handle a large-scale disaster or emergency, have a 3-day water supply for all living there, have a 3-day supply of non-perishable food for all living there or have a 3-day supply of prescription medicines for each person who takes prescribed medicines are shown below.
General Preparedness, Pennsylvania Adults, 2018
| Household is Not Prepared At All to Handle Large-Scale Disaster or Emergency* | Household Has 3-Day Water Supply for All Living There* ** | Household Has 3-Day Supply of Non-Perishable Food for All Living There* | Household Has 3-Day Supply of Prescription Medicines for Each Person Who Takes Prescribed Medicines* | |||||
|---|---|---|---|---|---|---|---|---|
| Demographics | % | CI | % | CI | % | CI | % | CI |
| All adults | 18 | 17-19 | 65 | 63-66 | 84 | 82-85 | 82 | 80-83 |
| Gender | ||||||||
| Male | 16 | 14-18 | 69 | 66-71 | 84 | 82-85 | 79 | 77-81 |
| Female | 20 | 18-22 | 61 | 58-63 | 83 | 82-85 | 84 | 82-86 |
| Age | ||||||||
| 18-29 | 24 | 20-28 | 60 | 55-65 | 78 | 73-81 | 70 | 65-74 |
| 30-44 | 23 | 20-26 | 57 | 53-61 | 82 | 79-85 | 70 | 66-74 |
| 45-64 | 16 | 14-18 | 66 | 64-69 | 84 | 82-86 | 87 | 85-88 |
| 65+ | 12 | 10-15 | 72 | 69-75 | 89 | 87-91 | 95 | 93-96 |
| Education | ||||||||
| < High school | 15 | 11-21 | 76 | 69-82 | 85 | 80-89 | 79 | 72-85 |
| High school | 19 | 16-21 | 70 | 67-73 | 84 | 82-87 | 83 | 80-85 |
| Some college | 18 | 15-21 | 63 | 60-67 | 83 | 80-85 | 81 | 78-84 |
| College degree | 19 | 16-21 | 55 | 52-57 | 83 | 81-85 | 82 | 80-84 |
| Household income | ||||||||
| < $15,000 | 29 | 23-36 | 72 | 65-78 | 78 | 72-84 | 81 | 74-87 |
| $15,000 to $24,999 | 22 | 18-26 | 70 | 66-75 | 84 | 80-88 | 83 | 79-86 |
| $25,000 to $49,999 | 21 | 17-24 | 64 | 60-68 | 81 | 77-84 | 80 | 76-83 |
| $50,000 to $74,999 | 17 | 13-21 | 64 | 59-68 | 84 | 80-87 | 80 | 76-84 |
| $75,000+ | 15 | 13-17 | 61 | 58-64 | 85 | 83-87 | 83 | 80-85 |
| Race | ||||||||
| White, non-Hispanic | 16 | 14-17 | 64 | 62-66 | 85 | 84-86 | 85 | 83-86 |
| Black, non-Hispanic | 28 | 23-33 | 67 | 62-72 | 75 | 70-79 | 71 | 66-76 |
| Hispanic | 27 | 20-36 | 69 | 60-77 | 83 | 76-88 | 72 | 63-79 |
| Sexual orientation | ||||||||
| Lesbian, gay or bisexual | 25 | 19-33 | 61 | 52-69 | 82 | 75-87 | 81 | 73-87 |
| Straight | 18 | 16-19 | 65 | 63-67 | 84 | 82-85 | 82 | 80-83 |
*Excludes missing, don't know and refused
**Defined as having one gallon of water per person per day
General Preparedness Prevalence per 1,000 Pennsylvania Population,
Pennsylvania Adults, 2013-2018
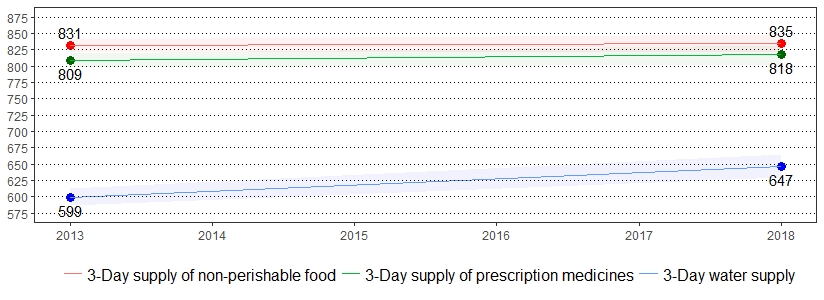
Color bands around estimates show 95% confidence intervals
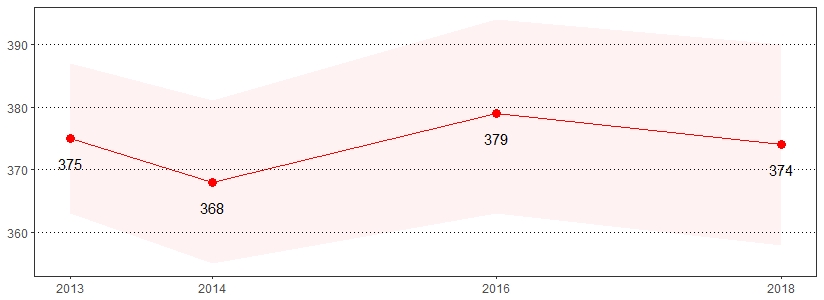
Two additional indicators related to health care access are: 1) not having a personal doctor or health care provider and 2) having had a time during the past 12 months when you needed to see a doctor but could not because of the cost. The estimate(s) of adults who indicated they have no personal health care provider and could not receive care in the past year due to cost are shown below.
Health Care Access, Pennsylvania Adults, 2018
| Does Not Have a Personal Health Care Provider* |
Couldn't Receive Care in the Past Year Due to Cost* | |||
|---|---|---|---|---|
| Demographics | % | CI | % | CI |
| All adults | 15 | 14-16 | 9 | 9-10 |
| Gender | ||||
| Male | 20 | 18-22 | 9 | 7-10 |
| Female | 11 | 10-12 | 10 | 9-12 |
| Age | ||||
| 18-29 | 31 | 27-35 | 13 | 11-16 |
| 30-44 | 22 | 19-25 | 10 | 8-13 |
| 45-64 | 8 | 7-10 | 10 | 9-12 |
| 65+ | 5 | 3-6 | 4 | 3-6 |
| Education | ||||
| < High school | 22 | 16-29 | 14 | 10-20 |
| High school | 15 | 13-17 | 10 | 9-12 |
| Some college | 16 | 14-18 | 10 | 8-12 |
| College degree | 12 | 11-14 | 6 | 5-7 |
| Household income | ||||
| < $15,000 | 14 | 10-20 | 14 | 10-19 |
| $15,000 to $24,999 | 17 | 14-21 | 15 | 12-19 |
| $25,000 to $49,999 | 19 | 16-22 | 12 | 10-14 |
| $50,000 to $74,999 | 15 | 12-19 | 12 | 9-16 |
| $75,000+ | 12 | 11-15 | 4 | 3-5 |
| Race | ||||
| White, non-Hispanic | 13 | 12-14 | 8 | 7-9 |
| Black, non-Hispanic | 16 | 13-21 | 11 | 9-15 |
| Hispanic | 28 | 22-35 | 18 | 13-24 |
| Sexual orientation | ||||
| Lesbian, gay or bisexual | 27 | 19-36 | 18 | 12-25 |
| Straight | 13 | 12-14 | 9 | 8-10 |
*Excludes missing, don't know and refused
Health Care Access Prevalence per 1,000 Pennsylvania Population,
Pennsylvania Adults, 2011-2018
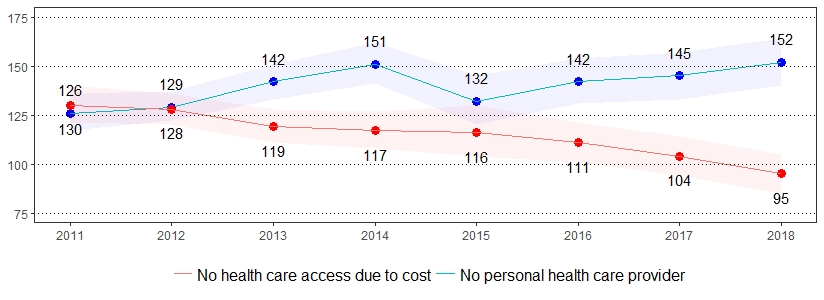
Color bands around estimates show 95% confidence intervals
Health care, or insurance coverage, includes private plans and plans such as Health Maintenance Organizations (HMOs) or governmental plans such as Medicare or the Indian Health Service. The estimate(s) of adults ages 18-64 who reported having no health care coverage and adults age 65 and older who have Medicare are shown below.
Health Care Coverage, Pennsylvania Adults, 2018
| No Health Insurance, Age 18-64* | Have Medicare, Age GE 65* | |||
|---|---|---|---|---|
| Demographics | % | CI | % | CI |
| All adults | 9 | 8-11 | 95 | 94-96 |
| Gender | ||||
| Male | 12 | 10-14 | 94 | 93-96 |
| Female | 7 | 5-8 | 96 | 94-97 |
| Age | ||||
| 18-29 | 17 | 13-21 | NSR | NSR |
| 30-44 | 8 | 6-10 | NSR | NSR |
| 45-64 | 6 | 5-8 | NSR | NSR |
| 65+ | NSR | NSR | 95 | 94-96 |
| Education | ||||
| < High school | 31 | 23-40 | 99 | 97-100 |
| High school | 11 | 9-13 | 97 | 94-98 |
| Some college | 7 | 5-9 | 95 | 92-97 |
| College degree | 3 | 2-4 | 91 | 88-93 |
| Household income | ||||
| < $15,000 | 6 | 4-10 | 98 | 94-99 |
| $15,000 to $24,999 | 20 | 15-25 | 97 | 93-98 |
| $25,000 to $49,999 | 13 | 10-17 | 96 | 92-98 |
| $50,000 to $74,999 | 9 | 6-14 | 98 | 95-99 |
| $75,000+ | 4 | 2-6 | 89 | 84-92 |
| Race | ||||
| White, non-Hispanic | 8 | 7-10 | 96 | 94-97 |
| Black, non-Hispanic | 13 | 9-17 | 94 | 85-98 |
| Hispanic | 16 | 11-22 | NSR | NSR |
| Sexual orientation | ||||
| Lesbian, gay or bisexual | 10 | 6-16 | NSR | NSR |
| Straight | 8 | 7-9 | 96 | 94-97 |
*Excludes missing, don't know and refused
Note: If "NSR" is displayed, then the total response is less than 50 and/or the percentage prevalence is considered "not statistically reliable."
No Health Insurance Prevalence per 1,000 Pennsylvania Population,
Pennsylvania Adults, Age 18-64, 2011-2018
Color bands around estimates show 95% confidence intervals
Vision loss means that a person's eyesight is not corrected to a "normal" level. Vision loss can be caused by damage to the eye itself, by the eye being shaped incorrectly or even by a problem in the brain.17
Approximately 15 percent of American adults (37.5 million) report some trouble hearing.18 The estimate(s) of adults who indicated they were deaf or have serious difficulty hearing or were ever blind or have serious difficulty seeing, even when wearing glasses, are shown below.
Hearing and Vision Problem, Pennsylvania Adults, 2018
| Deaf or Serious Difficulty Hearing* | Blind or Serious Difficulty Seeing, Even With Glasses* |
|||
|---|---|---|---|---|
| Demographics | % | CI | % | CI |
| All adults | 6 | 5-7 | 4 | 3-5 |
| Gender | ||||
| Male | 8 | 7-9 | 4 | 3-5 |
| Female | 4 | 4-5 | 4 | 3-5 |
| Age | ||||
| 18-29 | 1 | 0-4 | 1 | 1-2 |
| 30-44 | 2 | 2-4 | 2 | 1-3 |
| 45-64 | 7 | 5-8 | 6 | 4-7 |
| 65+ | 13 | 11-15 | 6 | 5-9 |
| Education | ||||
| < High school | 11 | 7-15 | 12 | 9-17 |
| High school | 8 | 6-9 | 5 | 4-6 |
| Some college | 5 | 4-7 | 3 | 2-4 |
| College degree | 3 | 2-4 | 1 | 1-2 |
| Household income | ||||
| < $15,000 | 11 | 8-16 | 12 | 9-17 |
| $15,000 to $24,999 | 11 | 8-15 | 8 | 6-11 |
| $25,000 to $49,999 | 8 | 6-10 | 4 | 3-6 |
| $50,000 to $74,999 | 4 | 3-6 | 3 | 1-5 |
| $75,000+ | 3 | 2-4 | 1 | 1-2 |
| Race | ||||
| White, non-Hispanic | 6 | 6-7 | 3 | 3-4 |
| Black, non-Hispanic | 4 | 2-7 | 6 | 4-9 |
| Hispanic | 7 | 3-14 | 7 | 4-12 |
| Sexual orientation | ||||
| Lesbian, gay or bisexual | 6 | 3-12 | 6 | 3-13 |
| Straight | 6 | 5-7 | 4 | 3-5 |
*Excludes missing, don't know and refused
Vision Problem Prevalence per 1,000 Pennsylvania Population,
Pennsylvania Adults, 2013-2018
Color bands around estimates show 95% confidence intervals
Human Immunodeficiency Virus (HIV) is a virus spread through certain body fluids that attacks the body's immune system, specifically the CD4 cells, often called T cells.19 The estimate(s) of adults age 18-64 who indicated they were ever tested for HIV (except during a blood donation) or that an HIV situation applies to them are shown below.
HIV/AIDS, Pennsylvania Adults, Age 18-64, 2018
| Ever Tested for HIV, Except Blood Donation* |
Tested for HIV in the Past Year, Except Blood Donation* | HIV Situation Applies* ** | ||||
|---|---|---|---|---|---|---|
| Demographics | % | CI | % | CI | % | CI |
| All adults | 42 | 40-44 | 13 | 12-15 | 8 | 7-9 |
| Gender | ||||||
| Male | 37 | 35-40 | 13 | 11-15 | 9 | 7-10 |
| Female | 47 | 44-49 | 14 | 12-16 | 7 | 5-8 |
| Age | ||||||
| 18-29 | 34 | 30-38 | 17 | 14-21 | 17 | 14-20 |
| 30-44 | 57 | 53-61 | 18 | 15-21 | 8 | 7-11 |
| 45-64 | 36 | 34-39 | 8 | 6-9 | 2 | 2-3 |
| Education | ||||||
| < High school | 42 | 34-51 | 21 | 14-30 | 10 | 6-17 |
| High school | 39 | 36-43 | 12 | 10-15 | 9 | 7-11 |
| Some college | 45 | 41-48 | 14 | 11-17 | 10 | 8-12 |
| College degree | 43 | 40-46 | 12 | 10-14 | 5 | 4-6 |
| Household income | ||||||
| < $15,000 | 62 | 54-69 | 33 | 24-42 | 12 | 7-20 |
| $15,000 to $24,999 | 55 | 49-61 | 22 | 17-29 | 15 | 10-20 |
| $25,000 to $49,999 | 44 | 39-48 | 14 | 11-17 | 10 | 7-12 |
| $50,000 to $74,999 | 39 | 34-44 | 13 | 10-18 | 7 | 5-11 |
| $75,000+ | 40 | 37-43 | 10 | 8-12 | 6 | 4-7 |
| Race | ||||||
| White, non-Hispanic | 36 | 33-38 | 8 | 7-10 | 7 | 6-8 |
| Black, non-Hispanic | 76 | 70-81 | 42 | 35-49 | 14 | 10-18 |
| Hispanic | 58 | 49-65 | 31 | 23-41 | 16 | 11-24 |
| Sexual orientation | ||||||
| Lesbian, gay or bisexual | 63 | 53-72 | 32 | 23-43 | 30 | 22-40 |
| Straight | 41 | 39-43 | 12 | 11-14 | 6 | 5-7 |
*Excludes missing, don't know and refused
**Defined as having injected unprescribed drugs, having been treated for a sexually transmitted or venereal disease, having given or received money or drugs in exchange for sex, had anal sex without a condom or had four or more sex partners in the past year
Ever Tested for HIV, Except Blood Donation Prevalence per 1,000 Pennsylvania Population,
Pennsylvania Adults, Age 18-64, 2011-2018
Color bands around estimates show 95% confidence intervals
It is estimated that about 12,000 new cases of HPV-associated cervical cancer are diagnosed in the United States each year.20 The estimate(s) of women who indicated they ever had a HPV test or had a HPV test in the past year are shown below.
Human Papilloma Virus (HPV) Test, Pennsylvania Women, 2018
| Ever Had a HPV Test* | Had a HPV Test in the Past Year* | |||
|---|---|---|---|---|
| Demographics | % | CI | % | CI |
| Gender | ||||
| Female | 48 | 45-51 | 41 | 37-45 |
| Age | ||||
| 18-29 | 45 | 38-53 | 56 | 46-66 |
| 30-44 | 70 | 64-76 | 43 | 36-49 |
| 45-64 | 53 | 49-58 | 36 | 30-42 |
| 65+ | 20 | 17-24 | 18 | 12-26 |
| Education | ||||
| < High school | 35 | 23-48 | NSR | NSR |
| High school | 38 | 34-43 | 47 | 39-54 |
| Some college | 50 | 45-56 | 38 | 31-45 |
| College degree | 62 | 58-66 | 40 | 35-45 |
| Household income | ||||
| < $15,000 | 44 | 34-55 | NSR | NSR |
| $15,000 to $24,999 | 42 | 35-49 | 45 | 34-56 |
| $25,000 to $49,999 | 54 | 48-61 | 35 | 27-43 |
| $50,000 to $74,999 | 50 | 43-58 | 42 | 32-52 |
| $75,000+ | 55 | 49-60 | 38 | 32-45 |
| Race | ||||
| White, non-Hispanic | 45 | 42-48 | 36 | 31-40 |
| Black, non-Hispanic | 65 | 57-73 | 49 | 40-59 |
| Hispanic | 60 | 48-72 | NSR | NSR |
| Sexual orientation | ||||
| Lesbian, gay or bisexual | NSR | NSR | NSR | NSR |
| Straight | 47 | 44-50 | 40 | 36-45 |
*Excludes missing, don't know and refused
Note: If "NSR" is displayed, then the total response is less than 50 and/or the percentage prevalence is considered "not statistically reliable."
Human Papilloma Virus (HPV) Prevalence per 1,000 Pennsylvania Population,
Pennsylvania Women, 2014-2018
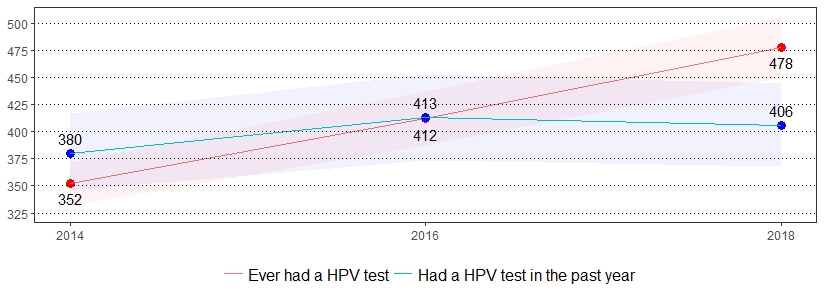
Color bands around estimates show 95% confidence intervals
Adult immunizations against influenza and pneumococcal disease are important health indicators that need to be routinely monitored.21 The estimate(s) of adults who indicated they had a flu shot or flu vaccine that was sprayed in the nose in the past year or are age 65 and older and ever had a pneumonia vaccination are shown below.
Immunization, Pennsylvania Adults, 2018
| Had Flu Shot or Flu Vaccine Sprayed in Nose in the Past Year* | Ever Had Pneumonia Vaccination, Age 65+* | |||
|---|---|---|---|---|
| Demographics | % | CI | % | CI |
| All adults | 40 | 39-42 | 75 | 72-78 |
| Gender | ||||
| Male | 37 | 34-39 | 71 | 67-76 |
| Female | 44 | 41-46 | 78 | 74-82 |
| Age | ||||
| 18-29 | 27 | 23-31 | NSR | NSR |
| 30-44 | 29 | 26-32 | NSR | NSR |
| 45-64 | 43 | 40-46 | NSR | NSR |
| 65+ | 60 | 56-63 | 75 | 72-78 |
| Education | ||||
| < High school | 34 | 28-42 | 71 | 60-81 |
| High school | 36 | 33-39 | 74 | 70-79 |
| Some college | 38 | 35-41 | 77 | 71-82 |
| College degree | 51 | 48-53 | 77 | 73-81 |
| Household income | ||||
| < $15,000 | 36 | 30-43 | 70 | 59-80 |
| $15,000 to $24,999 | 38 | 33-42 | 72 | 65-79 |
| $25,000 to $49,999 | 38 | 35-42 | 75 | 69-80 |
| $50,000 to $74,999 | 39 | 35-44 | 79 | 71-85 |
| $75,000+ | 44 | 42-47 | 75 | 69-80 |
| Race | ||||
| White, non-Hispanic | 41 | 39-43 | 77 | 74-80 |
| Black, non-Hispanic | 40 | 35-45 | 67 | 56-76 |
| Hispanic | 35 | 28-43 | NSR | NSR |
| Sexual orientation | ||||
| Lesbian, gay or bisexual | 35 | 27-44 | NSR | NSR |
| Straight | 41 | 39-43 | 75 | 72-78 |
*Excludes missing, don't know and refused
Note: If "NSR" is displayed, then the total response is less than 50 and/or the percentage prevalence is considered "not statistically reliable."
Immunization Prevalence per 1,000 Pennsylvania Population,
Pennsylvania Adults, 2011-2018
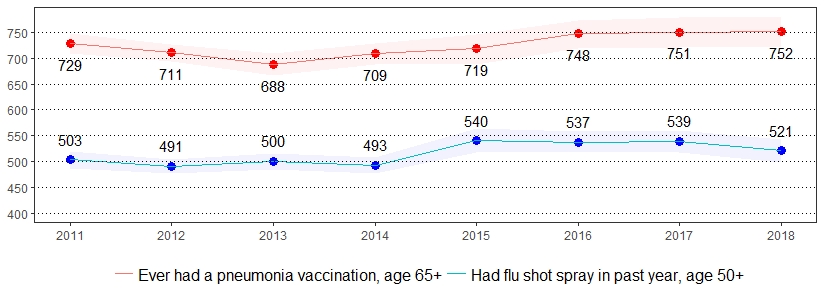
Color bands around estimates show 95% confidence intervals
Inadequate sleep can lead to serious health problems, including heart disease, heart attack, heart failure, irregular heartbeat, high blood pressure, stroke and diabetes.22 The estimate(s) of adults who indicated they average six or fewer hours of sleep in a 24-hour period or average seven to nine hours of sleep in a 24-hour period are shown below.
Inadequate Sleep, Pennsylvania Adults, 2018
| Average 6 or Fewer Hours of Sleep in a 24-Hour Period* |
Average 7-9 Hours of Sleep in a 24-Hour Period* |
|||
|---|---|---|---|---|
| Demographics | % | CI | % | CI |
| All adults | 37 | 36-39 | 60 | 58-61 |
| Gender | ||||
| Male | 38 | 35-40 | 59 | 57-62 |
| Female | 37 | 35-39 | 60 | 58-62 |
| Age | ||||
| 18-29 | 37 | 33-41 | 62 | 57-66 |
| 30-44 | 44 | 41-48 | 54 | 51-58 |
| 45-64 | 40 | 37-42 | 57 | 55-60 |
| 65+ | 28 | 25-31 | 67 | 64-70 |
| Education | ||||
| < High school | 37 | 31-44 | 57 | 50-64 |
| High school | 40 | 37-43 | 56 | 53-59 |
| Some college | 41 | 38-44 | 57 | 54-60 |
| College degree | 31 | 29-34 | 67 | 65-69 |
| Household income | ||||
| < $15,000 | 40 | 34-46 | 51 | 45-58 |
| $15,000 to $24,999 | 48 | 44-53 | 46 | 42-51 |
| $25,000 to $49,999 | 38 | 35-42 | 58 | 54-62 |
| $50,000 to $74,999 | 37 | 32-41 | 61 | 57-66 |
| $75,000+ | 36 | 33-39 | 63 | 60-66 |
| Race | ||||
| White, non-Hispanic | 36 | 34-37 | 62 | 60-64 |
| Black, non-Hispanic | 48 | 43-53 | 48 | 43-53 |
| Hispanic | 46 | 38-53 | 52 | 44-59 |
| Sexual orientation | ||||
| Lesbian, gay or bisexual | 49 | 40-58 | 47 | 38-55 |
| Straight | 38 | 36-40 | 59 | 57-61 |
*Excludes missing, don't know and refused
Average 6 or Fewer Hours of Sleep in a 24-Hour Period Prevalence per 1,000 Pennsylvania Population, Pennsylvania Adults, 2013-2018
Color bands around estimates show 95% confidence intervals
Kidney disease is a condition in which the kidneys are damaged and are unable to filter blood properly. Adults with diabetes or hypertension are at an increased risk of kidney disease.23 The estimate(s) of adults who indicated they were ever told they have a kidney disease are shown below.
Kidney Disease, Pennsylvania Adults, 2018
| Ever Told Have Kidney Disease* | ||
|---|---|---|
| Demographics | % | CI |
| All adults | 3 | 3-4 |
| Gender | ||
| Male | 3 | 2-3 |
| Female | 3 | 3-4 |
| Age | ||
| 18-29 | 2 | 1-4 |
| 30-44 | 1 | 1-2 |
| 45-64 | 4 | 3-5 |
| 65+ | 6 | 5-8 |
| Education | ||
| < High school | 6 | 4-10 |
| High school | 3 | 3-5 |
| Some college | 3 | 2-4 |
| College degree | 2 | 2-3 |
| Household income | ||
| < $15,000 | 8 | 5-13 |
| $15,000 to $24,999 | 6 | 4-9 |
| $25,000 to $49,999 | 3 | 2-4 |
| $50,000 to $74,999 | 2 | 1-3 |
| $75,000+ | 2 | 1-3 |
| Race | ||
| White, non-Hispanic | 3 | 3-4 |
| Black, non-Hispanic | 4 | 2-6 |
| Hispanic | 3 | 1-10 |
| Sexual orientation | ||
| Lesbian, gay or bisexual | 6 | 3-12 |
| Straight | 3 | 3-4 |
*Excludes missing, don't know and refused
Kidney Disease Prevalence per 1,000 Pennsylvania Population,
Pennsylvania Adults, 2011-2018
Color bands around estimates show 95% confidence intervals
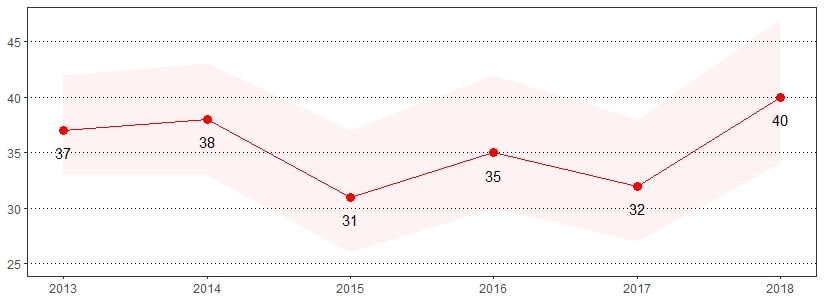
There were approximately 2.9 million nonfatal workplace injuries and illnesses reported by private industry employers in 2016, which occurred at a rate of 2.9 cases per 100 full-time equivalent (FTE) workers.24 The estimate(s) of adults who indicated they received medical advice after being injured seriously enough performing their job in the past year are shown below.
Occupational Health, Pennsylvania Adults, 2018
| Received Medical Advice After Being Injured Seriously Enough Performing Their Job in the Past Year* |
||
|---|---|---|
| Demographics | % | CI |
| All adults | 5 | 4-6 |
| Gender | ||
| Male | 6 | 5-8 |
| Female | 4 | 3-6 |
| Age | ||
| 18-29 | 8 | 5-13 |
| 30-44 | 7 | 5-9 |
| 45-64 | 4 | 3-6 |
| 65+ | 3 | 2-7 |
| Education | ||
| < High school | 7 | 3-17 |
| High school | 6 | 5-9 |
| Some college | 7 | 5-10 |
| College degree | 4 | 2-5 |
| Household income | ||
| < $15,000 | 1 | 0-7 |
| $15,000 to $24,999 | 11 | 6-20 |
| $25,000 to $49,999 | 8 | 5-11 |
| $50,000 to $74,999 | 8 | 5-11 |
| $75,000+ | 4 | 3-5 |
| Race | ||
| White, non-Hispanic | 5 | 4-7 |
| Black, non-Hispanic | 6 | 3-10 |
| Hispanic | 9 | 4-20 |
| Sexual orientation | ||
| Lesbian, gay or bisexual | NSR | NSR |
| Straight | 5 | 4-7 |
*Excludes missing, don't know and refused
Note: If "NSR" is displayed, then the total response is less than 50 and/or the percentage prevalence is considered "not statistically reliable."
Note: No trend available. These questions were first asked in 2018.
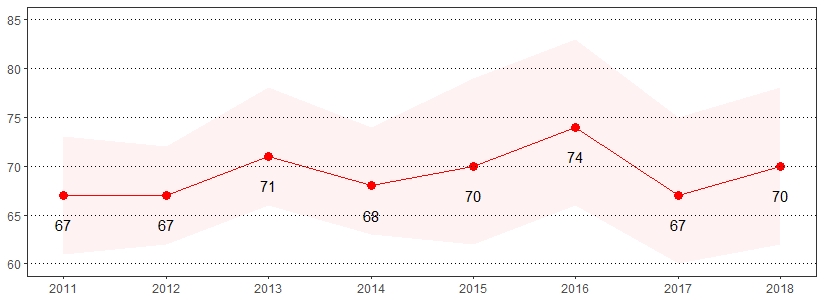
Many diseases, such as diabetes, heart disease, HIV and cancer (as well as some eating disorders) are linked with oral health problems.25 The estimate(s) of adults who indicated they visited a dentist in the past year, had any permanent teeth removed or had their teeth cleaned by a dentist or dental hygienist in the past year are shown below.
Oral Health, Pennsylvania Adults, 2018
| Visited a Dentist in the Past Year* | Had Any Permanent Teeth Removed* ** | Had Teeth Cleaned by a Dentist or Dental Hygienist in the Past Year* | ||||
|---|---|---|---|---|---|---|
| Demographics | % | CI | % | CI | % | CI |
| All adults | 69 | 68-71 | 45 | 44-47 | 70 | 69-72 |
| Gender | ||||||
| Male | 66 | 64-69 | 43 | 41-46 | 67 | 64-69 |
| Female | 72 | 70-74 | 47 | 45-50 | 74 | 71-76 |
| Age | ||||||
| 18-29 | 70 | 66-74 | 15 | 12-19 | 69 | 64-73 |
| 30-44 | 67 | 63-70 | 34 | 31-38 | 66 | 62-70 |
| 45-64 | 72 | 70-75 | 53 | 50-55 | 72 | 69-74 |
| 65+ | 67 | 64-70 | 73 | 71-76 | 73 | 70-76 |
| Education | ||||||
| < High school | 47 | 40-54 | 66 | 59-73 | 50 | 42-58 |
| High school | 65 | 62-68 | 52 | 49-55 | 67 | 64-70 |
| Some college | 72 | 69-75 | 47 | 43-50 | 70 | 67-73 |
| College degree | 82 | 80-83 | 28 | 26-31 | 81 | 79-83 |
| Household income | ||||||
| < $15,000 | 45 | 38-51 | 63 | 57-70 | 44 | 36-52 |
| $15,000 to $24,999 | 51 | 47-56 | 64 | 59-68 | 55 | 50-60 |
| $25,000 to $49,999 | 65 | 62-69 | 55 | 51-58 | 65 | 61-69 |
| $50,000 to $74,999 | 72 | 68-76 | 45 | 40-49 | 72 | 67-77 |
| $75,000+ | 83 | 80-85 | 30 | 28-33 | 82 | 79-84 |
| Race | ||||||
| White, non-Hispanic | 71 | 69-73 | 45 | 44-47 | 72 | 70-74 |
| Black, non-Hispanic | 61 | 56-66 | 54 | 49-59 | 61 | 56-67 |
| Hispanic | 69 | 62-76 | 40 | 33-48 | 68 | 59-75 |
| Sexual orientation | ||||||
| Lesbian, gay or bisexual | 66 | 58-74 | 40 | 32-50 | 66 | 58-74 |
| Straight | 70 | 68-72 | 47 | 45-49 | 71 | 69-73 |
*Excludes missing, don't know and refused
**Due to tooth decay or gum disease
Visited a Dentist in the Past Year Prevalence per 1,000 Pennsylvania Population,
Pennsylvania Adults, 2012-2018
Color bands around estimates show 95% confidence intervals
Being overweight or obese has been proven to increase the risk of many diseases and health conditions such as high blood pressure, diabetes, coronary heart disease, stroke, gallbladder disease, high cholesterol and some forms of cancer.26 The estimate(s) of adults who indicated they were overweight, obese or overweight and obese are shown below.
Overweight and Obese, Pennsylvania Adults, 2018
| Overweight* (BMI 25-29) |
Obese* (BMI >= 30) |
Overweight & Obese* (BMI >= 25) |
||||
|---|---|---|---|---|---|---|
| Demographics | % | CI | % | CI | % | CI |
| All adults | 35 | 34-37 | 31 | 29-32 | 66 | 64-68 |
| Gender | ||||||
| Male | 41 | 39-43 | 31 | 29-33 | 72 | 69-74 |
| Female | 29 | 27-32 | 31 | 29-33 | 60 | 58-63 |
| Age | ||||||
| 18-29 | 27 | 24-31 | 20 | 17-24 | 48 | 43-52 |
| 30-44 | 35 | 32-39 | 33 | 30-37 | 69 | 65-72 |
| 45-64 | 36 | 33-39 | 38 | 35-40 | 74 | 71-76 |
| 65+ | 39 | 36-42 | 28 | 26-31 | 68 | 64-71 |
| Education | ||||||
| < High school | 36 | 29-43 | 27 | 21-34 | 63 | 55-70 |
| High school | 34 | 32-37 | 32 | 30-35 | 67 | 64-70 |
| Some college | 32 | 29-35 | 36 | 33-39 | 68 | 65-71 |
| College degree | 38 | 36-40 | 26 | 24-28 | 64 | 62-67 |
| Household income | ||||||
| < $15,000 | 35 | 29-42 | 34 | 29-41 | 70 | 63-76 |
| $15,000 to $24,999 | 34 | 30-39 | 32 | 28-37 | 66 | 62-71 |
| $25,000 to $49,999 | 35 | 31-38 | 33 | 30-37 | 68 | 64-72 |
| $50,000 tot $74,999 | 34 | 30-39 | 32 | 28-37 | 66 | 62-71 |
| $75,000+ | 37 | 34-40 | 29 | 27-32 | 66 | 63-69 |
| Race | ||||||
| White, non-Hispanic | 36 | 34-37 | 30 | 28-32 | 66 | 64-67 |
| Black, non-Hispanic | 32 | 27-37 | 42 | 37-47 | 74 | 69-78 |
| Hispanic | 38 | 30-45 | 35 | 28-43 | 73 | 65-79 |
| Sexual orientation | ||||||
| Lesbian, gay or bisexual | 25 | 18-33 | 34 | 26-43 | 59 | 49-68 |
| Straight | 35 | 33-37 | 31 | 29-33 | 66 | 64-68 |
*Excludes missing, don't know and refused
Note: The Body Mass Index (BMI), which describes relative weight for height, is significantly correlated with total body fat content. BMI is calculated as mass (kg)/height2 (m2) and estimated using pounds and inches by [weight (pound)/height2 (inches2)] x 703. Individuals with a BMI of 25 to 29.9 are considered overweight, while individuals with a BMI >= 30 are considered obese.
Overweight and Obese Prevalence per 1,000 Pennsylvania Population,
Pennsylvania Adults, 2011-2018
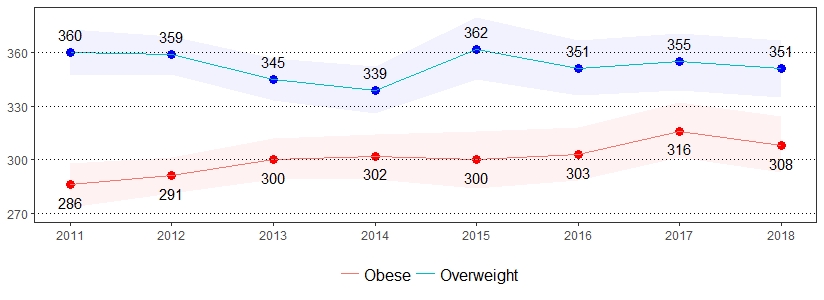
Color bands around estimates show 95% confidence intervals
A pap test is a screening procedure for cervical cancer. It tests for the presence of precancerous or cancerous cells on the cervix, the opening of the uterus.27 Cervical cancer tends to occur in midlife. Most cases are found in women between the ages of 20-50.28 The estimate(s) of women who indicated they ever had a pap test, had a pap test in the past three years, had a pap test in the past five years or ever had a hysterectomy are shown below.
Pap Test, Pennsylvania Women, 2018
| Ever Had a Pap Test* | Had a Pap Test in the Past 3 Years* | Had a Pap Test in the Past 5 Years* | Ever Had a Hysterectomy* | |||||
|---|---|---|---|---|---|---|---|---|
| Demographics | % | CI | % | CI | % | CI | % | CI |
| Gender | ||||||||
| Female | 89 | 87-91 | 62 | 60-65 | 70 | 68-72 | 19 | 17-20 |
| Age | ||||||||
| 18-29 | 54 | 47-61 | 50 | 43-57 | 51 | 44-58 | 0 | 0-2 |
| 30-44 | 96 | 92-98 | 81 | 76-85 | 87 | 83-91 | 7 | 5-10 |
| 45-64 | 97 | 96-98 | 72 | 68-75 | 81 | 78-84 | 22 | 19-25 |
| 65+ | 96 | 93-98 | 40 | 36-44 | 52 | 47-56 | 37 | 33-42 |
| Education | ||||||||
| < High school | 86 | 75-93 | 40 | 30-51 | 50 | 39-61 | 24 | 17-34 |
| High school | 86 | 81-89 | 57 | 53-62 | 63 | 59-68 | 23 | 20-27 |
| Some college | 87 | 83-90 | 61 | 56-65 | 70 | 65-74 | 20 | 17-23 |
| College degree | 96 | 94-97 | 77 | 74-80 | 84 | 82-87 | 10 | 9-13 |
| Household income | ||||||||
| < $15,000 | 88 | 79-93 | 57 | 48-66 | 68 | 59-75 | 25 | 19-34 |
| $15,000 to $24,999 | 87 | 81-92 | 52 | 46-59 | 60 | 54-67 | 25 | 20-31 |
| $25,000 to $49,999 | 91 | 85-94 | 63 | 57-68 | 70 | 64-75 | 18 | 15-23 |
| $50,000 to $74,999 | 90 | 85-94 | 63 | 56-69 | 74 | 67-80 | 16 | 12-21 |
| $75,000+ | 91 | 86-94 | 73 | 68-77 | 80 | 75-84 | 13 | 11-16 |
| Race | ||||||||
| White, non-Hispanic | 90 | 88-92 | 60 | 57-63 | 68 | 65-71 | 20 | 18-22 |
| Black, non-Hispanic | 92 | 87-95 | 76 | 69-82 | 83 | 77-88 | 18 | 13-24 |
| Hispanic | 82 | 71-89 | 70 | 58-80 | 75 | 63-84 | 10 | 5-19 |
| Sexual orientation | ||||||||
| Lesbian, gay or bisexual | NSR | NSR | 69 | 55-80 | NSR | NSR | 9 | 5-18 |
| Straight | 90 | 88-92 | 62 | 59-65 | 70 | 68-73 | 20 | 18-22 |
*Excludes missing, don't know and refused
Note: If "NSR" is displayed, then the total response is less than 50 and/or the percentage prevalence is considered "not statistically reliable."
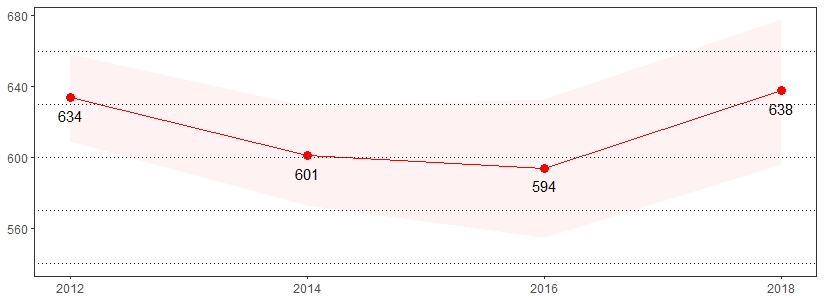
Pap Test Prevalence per 1,000 Pennsylvania Population,
Pennsylvania Women, 2012-2018
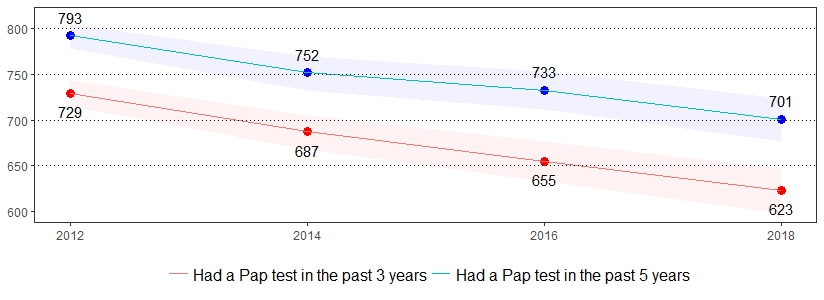
Color bands around estimates show 95% confidence intervals
Impairment is an absence of, or significant difference in, a person's body structure or function or mental functioning.29 One in 25 United States adults reported having difficulty dressing or bathing, and one in 15 United States adults reported having difficulty doing errands alone due to a health condition.30 The estimate(s) of adults who indicated they had difficulty making decisions due to a health condition, had difficulty walking or climbing stairs, had difficulty dressing or bathing, or had difficulty doing errands alone due to a health condition are shown below.
Physical Impairments, Pennsylvania Adults, 2018
| Have Difficulty Making Decisions Due to Health Condition* ** |
Have Difficulty Walking or Climbing Stairs* |
Have Difficulty Dressing or Bathing* | Have Difficulty Doing Errands Alone Due to Health Condition* ** |
|||||
|---|---|---|---|---|---|---|---|---|
| Demographics | % | CI | % | CI | % | CI | % | CI |
| All adults | 12 | 11-14 | 13 | 12-14 | 3 | 3-4 | 7 | 7-8 |
| Gender | ||||||||
| Male | 11 | 9-12 | 11 | 9-12 | 4 | 3-5 | 5 | 4-6 |
| Female | 14 | 13-16 | 15 | 14-17 | 3 | 3-4 | 9 | 8-11 |
| Age | ||||||||
| 18-29 | 19 | 15-23 | 2 | 1-4 | 1 | 0-3 | 6 | 4-9 |
| 30-44 | 14 | 11-16 | 7 | 5-9 | 3 | 2-5 | 7 | 5-9 |
| 45-64 | 12 | 10-14 | 17 | 15-19 | 5 | 4-6 | 9 | 7-10 |
| 65+ | 8 | 6-10 | 23 | 20-26 | 4 | 3-6 | 8 | 7-10 |
| Education | ||||||||
| < High school | 23 | 18-30 | 26 | 21-32 | 8 | 5-11 | 12 | 9-17 |
| High school | 16 | 14-18 | 16 | 14-18 | 5 | 4-6 | 9 | 7-10 |
| Some college | 11 | 9-14 | 12 | 10-14 | 2 | 2-3 | 8 | 7-10 |
| College degree | 6 | 5-7 | 5 | 4-6 | 1 | 1-2 | 3 | 2-4 |
| Household income | ||||||||
| < $15,000 | 35 | 29-42 | 40 | 33-46 | 19 | 14-25 | 25 | 20-31 |
| $15,000 to $24,999 | 25 | 21-30 | 27 | 23-31 | 7 | 5-9 | 14 | 11-17 |
| $25,000 to $49,999 | 13 | 11-16 | 12 | 10-15 | 3 | 2-4 | 7 | 5-10 |
| $50,000 to $74,999 | 8 | 5-11 | 8 | 6-10 | 1 | 0-2 | 3 | 2-5 |
| $75,000+ | 5 | 4-7 | 4 | 3-5 | 1 | 0-1 | 2 | 1-3 |
| Race | ||||||||
| White, non-Hispanic | 11 | 10-12 | 13 | 12-14 | 3 | 3-4 | 7 | 6-8 |
| Black, non-Hispanic | 22 | 18-28 | 18 | 15-22 | 5 | 4-8 | 9 | 7-13 |
| Hispanic | 16 | 11-23 | 10 | 7-15 | 4 | 2-8 | 9 | 5-14 |
| Sexual orientation | ||||||||
| Lesbian, gay or bisexual | 29 | 21-39 | 13 | 7-20 | 5 | 2-12 | 18 | 11-27 |
| Straight | 11 | 10-13 | 13 | 12-14 | 4 | 3-4 | 7 | 6-8 |
*Excludes missing, don't know and refused
**Includes physical, mental or emotional problems
Physical Impairments Prevalence per 1,000 Pennsylvania Population,
Pennsylvania Adults, 2013-2018
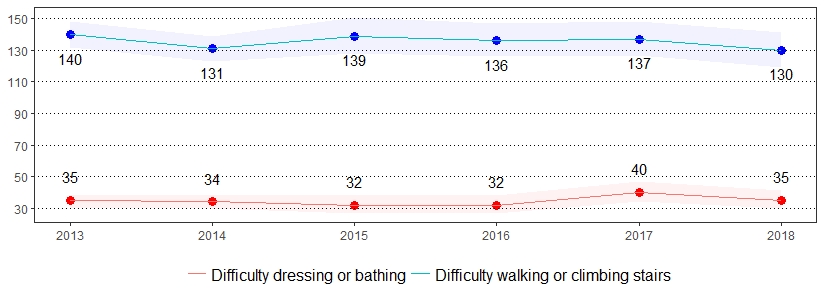
Color bands around estimates show 95% confidence intervals
About one out of seven men will be diagnosed with prostate cancer during his lifetime and about one out of 39 men will die of prostate cancer.31 Prostate-specific antigen (PSA) is a protein produced by both cancerous and noncancerous tissue in the prostate.32 The estimate(s) of men age 50 and older who indicated that a health professional ever recommended a PSA test, ever had a PSA test, or had a PSA test in the past year are shown below.
Prostate Cancer Screening, Pennsylvania Men, Age 50+, 2018
| Health Professional Ever Recommended PSA Test* | Ever Had a PSA Test* | Had a PSA Test in the Past Year* | ||||
|---|---|---|---|---|---|---|
| Demographics | % | CI | % | CI | % | CI |
| Gender | ||||||
| Male | 50 | 47-53 | 55 | 52-59 | 64 | 60-68 |
| Age | ||||||
| 50-64 | 44 | 40-48 | 48 | 43-52 | 62 | 55-68 |
| 65-74 | 63 | 57-69 | 70 | 64-75 | 70 | 63-76 |
| 75+ | 48 | 40-56 | 55 | 47-64 | 56 | 46-66 |
| Education | ||||||
| < High school | 34 | 25-46 | 34 | 24-45 | NSR | NSR |
| High school | 45 | 40-51 | 50 | 45-56 | 68 | 60-75 |
| Some college | 50 | 44-57 | 57 | 50-63 | 56 | 47-65 |
| College degree | 62 | 58-67 | 70 | 66-75 | 64 | 59-70 |
| Household income | ||||||
| < $15,000 | 37 | 25-51 | NSR | NSR | NSR | NSR |
| $15,000 to $24,999 | 41 | 31-50 | 45 | 36-55 | NSR | NSR |
| $25,000 to $49,999 | 46 | 39-53 | 50 | 43-57 | 61 | 50-70 |
| $50,000 to $74,999 | 55 | 47-64 | 62 | 53-70 | 67 | 57-77 |
| $75,000+ | 54 | 49-59 | 62 | 56-67 | 63 | 56-69 |
| Race | ||||||
| White, non-Hispanic | 52 | 48-55 | 57 | 53-60 | 63 | 58-67 |
| Black, non-Hispanic | 42 | 32-53 | 56 | 45-66 | NSR | NSR |
| Hispanic | NSR | NSR | NSR | NSR | NSR | NSR |
| Sexual orientation | ||||||
| Lesbian, gay or bisexual | NSR | NSR | NSR | NSR | NSR | NSR |
| Straight | 51 | 47-55 | 57 | 54-61 | 65 | 60-69 |
*Excludes missing, don't know and refused
Note: If "NSR" is displayed, then the total response is less than 50 and/or the percentage prevalence is considered "not statistically reliable."
Had a PSA Test in the Past Year Prevalence per 1,000 Pennsylvania Population,
Pennsylvania Men, Age 50+, 2012-2018
Color bands around estimates show 95% confidence intervals
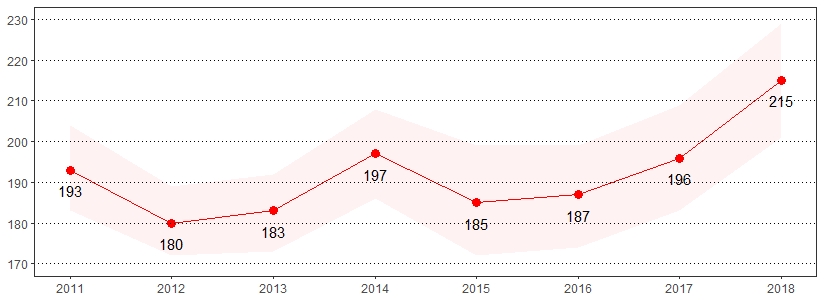
Physically and mentally unhealthy days measure the number of days within the past 30 days that individuals rate their physical and mental health as not good. The estimate(s) of adults who reported one or more physically or mentally unhealthy days are shown below.
Quality of Life, Pennsylvania Adults, 2018
| Physical Health Not Good 1+ Days in the Past Month* |
Mental Health Not Good 1+ Days in the Past Month* |
|||
|---|---|---|---|---|
| Demographics | % | CI | % | CI |
| All adults | 37 | 35-39 | 39 | 37-40 |
| Gender | ||||
| Male | 34 | 32-36 | 33 | 31-35 |
| Female | 40 | 37-42 | 44 | 42-46 |
| Age | ||||
| 18-29 | 36 | 32-41 | 57 | 52-61 |
| 30-44 | 34 | 31-37 | 45 | 42-49 |
| 45-64 | 39 | 36-41 | 36 | 33-38 |
| 65+ | 39 | 36-42 | 23 | 20-26 |
| Education | ||||
| < High school | 43 | 36-50 | 36 | 30-43 |
| High school | 38 | 35-40 | 37 | 35-40 |
| Some college | 38 | 35-41 | 42 | 39-45 |
| College degree | 34 | 31-36 | 38 | 36-41 |
| Household income | ||||
| < $15,000 | 56 | 49-63 | 52 | 45-59 |
| $15,000 to $24,999 | 49 | 45-54 | 47 | 42-52 |
| $25,000 to $49,999 | 41 | 37-45 | 42 | 38-46 |
| $50,000 to $74,999 | 35 | 31-39 | 36 | 31-40 |
| $75,000+ | 29 | 27-32 | 36 | 33-39 |
| Race | ||||
| White, non-Hispanic | 37 | 35-39 | 38 | 36-39 |
| Black, non-Hispanic | 43 | 38-48 | 45 | 40-51 |
| Hispanic | 37 | 30-45 | 43 | 36-51 |
| Sexual orientation | ||||
| Lesbian, gay or bisexual | 48 | 39-57 | 65 | 56-73 |
| Straight | 37 | 35-39 | 38 | 37-40 |
*Excludes missing, don't know and refused
Poor Physical and Mental Health Prevalence per 1,000 Pennsylvania Population,
Pennsylvania Adults, 2011-2018
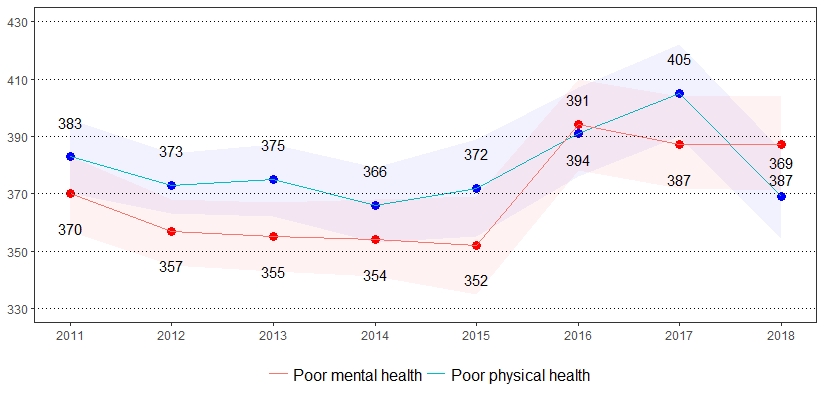
Color bands around estimates show 95% confidence intervals
Chronic respiratory diseases (CRDs) are diseases of the airways and other structures of the lung. In addition to tobacco smoke, other risk factors include air pollution, occupational chemicals and dusts, and frequent lower respiratory infections during childhood.33 The estimate(s) of who indicated they had a cough on most days in the past three months, have shortness of breath when hurrying on level ground or climbing a slight hill or stairs, have ever been given a breathing test to diagnose breathing problems or smoked tobacco products for at least five years in their lifetime are shown below.
Respiratory Health, Pennsylvania Adults, 2018
| Had a Cough on Most Days in the Past 3 Months* | Have Shortness of Breath When Hurrying on Level Ground or Climbing a Slight Hill or Stairs* | Ever Given a Breathing Test to Diagnose Breathing Problems* | Smoked Tobacco Products at Least 5 Years in Their Lifetime* | |||||
|---|---|---|---|---|---|---|---|---|
| Demographics | % | CI | % | CI | % | CI | % | CI |
| All adults | 13 | 12-14 | 22 | 21-24 | 31 | 29-32 | 38 | 36-39 |
| Gender | ||||||||
| Male | 12 | 11-14 | 18 | 16-20 | 30 | 28-33 | 41 | 38-43 |
| Female | 14 | 12-15 | 26 | 24-29 | 31 | 28-33 | 35 | 32-37 |
| Age | ||||||||
| 18-29 | 13 | 10-17 | 18 | 14-22 | 21 | 17-25 | 17 | 14-21 |
| 30-44 | 11 | 9-14 | 16 | 14-20 | 22 | 19-26 | 41 | 37-45 |
| 45-64 | 13 | 11-15 | 22 | 20-25 | 33 | 31-36 | 42 | 39-45 |
| 65+ | 16 | 13-18 | 33 | 30-36 | 41 | 38-45 | 45 | 42-48 |
| Education | ||||||||
| < High school | 21 | 15-27 | 38 | 31-46 | 33 | 27-41 | 52 | 44-60 |
| High school | 14 | 12-17 | 25 | 22-28 | 31 | 28-34 | 44 | 41-47 |
| Some college | 13 | 11-16 | 24 | 21-27 | 33 | 30-36 | 37 | 34-40 |
| College degree | 8 | 7-10 | 13 | 11-14 | 27 | 24-29 | 25 | 23-27 |
| Household income | ||||||||
| < $15,000 | 22 | 17-29 | 52 | 44-59 | 46 | 38-53 | 53 | 45-60 |
| $15,000 to $24,999 | 19 | 16-23 | 38 | 33-43 | 42 | 37-47 | 50 | 45-55 |
| $25,000 to $49,999 | 14 | 11-16 | 26 | 23-30 | 31 | 28-35 | 44 | 40-49 |
| $50,000 to $74,999 | 17 | 13-22 | 18 | 15-22 | 29 | 25-33 | 40 | 35-45 |
| $75,000+ | 8 | 6-10 | 10 | 9-12 | 26 | 23-29 | 29 | 27-32 |
| Race | ||||||||
| White, non-Hispanic | 13 | 11-14 | 22 | 21-24 | 31 | 29-33 | 38 | 36-40 |
| Black, non-Hispanic | 17 | 13-21 | 30 | 25-36 | 33 | 28-39 | 40 | 35-46 |
| Hispanic | 9 | 6-15 | 21 | 14-30 | 29 | 21-39 | 36 | 27-46 |
| Sexual orientation | ||||||||
| Lesbian, gay or bisexual | 11 | 7-17 | 32 | 24-41 | 33 | 25-41 | 46 | 38-55 |
| Straight | 13 | 12-14 | 22 | 20-24 | 30 | 29-32 | 37 | 36-39 |
*Excludes missing, don't know and refused
Note: No trend available. These questions were first asked in 2018.
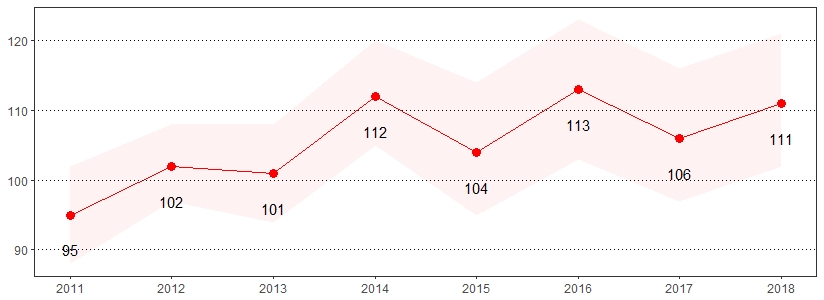
Seat belt use is the most effective way to save lives and reduce injuries in crashes.34 Seat belts have saved an estimated 318,000 lives between 1975 and 2013.35 The estimate(s) of adults who indicated they always use seatbelts when driving or riding in a car, always or nearly always use seatbelts when driving or riding in a car, or seldom or never use seatbelts when driving or riding in a car are shown below.
Seatbelt Use, Pennsylvania Adults, 2018
| Always Use Seatbelts When Driving or Riding in a Car* | Always or Nearly Always Use Seatbelts When Driving or Riding in a Car* | Seldom or Never Use Seatbelts When Driving or Riding in a Car* | ||||
|---|---|---|---|---|---|---|
| Demographics | % | CI | % | CI | % | CI |
| All adults | 79 | 78-81 | 89 | 88-90 | 6 | 5-6 |
| Gender | ||||||
| Male | 74 | 72-76 | 86 | 84-88 | 7 | 6-9 |
| Female | 84 | 83-86 | 92 | 90-93 | 4 | 3-5 |
| Age | ||||||
| 18-29 | 73 | 69-77 | 85 | 82-88 | 6 | 4-9 |
| 30-44 | 77 | 73-80 | 88 | 85-90 | 6 | 5-9 |
| 45-64 | 82 | 80-84 | 90 | 88-91 | 6 | 5-7 |
| 65+ | 84 | 82-86 | 92 | 90-94 | 4 | 3-5 |
| Education | ||||||
| < High school | 67 | 59-73 | 79 | 72-84 | 10 | 6-16 |
| High school | 76 | 74-79 | 86 | 84-88 | 7 | 6-9 |
| Some college | 79 | 76-81 | 89 | 87-91 | 6 | 4-8 |
| College degree | 89 | 87-90 | 96 | 95-97 | 2 | 1-2 |
| Household income | ||||||
| < $15,000 | 73 | 67-79 | 84 | 79-88 | 6 | 4-10 |
| $15,000 to $24,999 | 75 | 70-78 | 82 | 79-86 | 10 | 8-14 |
| $25,000 to $49,999 | 76 | 72-79 | 87 | 84-89 | 6 | 5-9 |
| $50,000 to $74,999 | 78 | 74-82 | 89 | 84-92 | 4 | 2-7 |
| $75,000+ | 85 | 83-87 | 94 | 92-95 | 3 | 2-4 |
| Race | ||||||
| White, non-Hispanic | 80 | 78-82 | 90 | 88-91 | 6 | 5-7 |
| Black, non-Hispanic | 74 | 69-78 | 83 | 79-87 | 6 | 4-9 |
| Hispanic | 80 | 73-85 | 89 | 83-92 | 6 | 3-9 |
| Sexual orientation | ||||||
| Lesbian, gay or bisexual | 78 | 70-84 | 86 | 79-91 | 9 | 5-15 |
| Straight | 79 | 77-80 | 89 | 87-90 | 6 | 5-7 |
*Excludes missing, don't know and refused
Always Use a Seatbelt Prevalence per 1,000 Pennsylvania Population,
Pennsylvania Adults, 2011-2018
Color bands around estimates show 95% confidence intervals
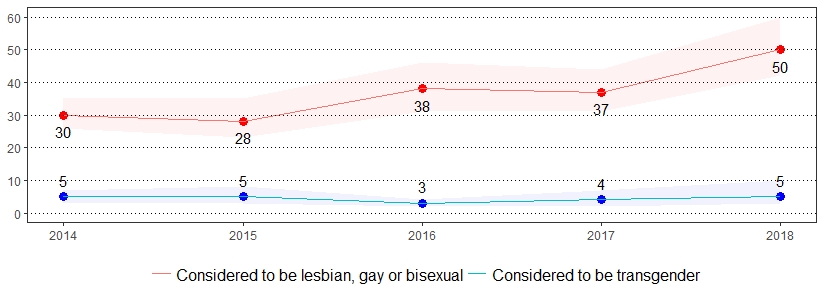
Approximately, 1.4 million adults in the United States identify as transgender.36 The estimate(s) of adults who indicated they were considered lesbian, gay or bisexual or were considered transgender are shown below.
Sexual Orientation and Gender Identity, Pennsylvania Adults, 2018
| Considered to be Lesbian, Gay or Bisexual* | Considered to be Transgender* | |||
|---|---|---|---|---|
| Demographics | % | CI | % | CI |
| All adults | 5 | 4-6 | 1 | 0-1 |
| Gender | ||||
| Male | 4 | 3-5 | 1 | 0-1 |
| Female | 6 | 5-8 | 1 | 0-1 |
| Age | ||||
| 18-29 | 10 | 8-14 | 3 | 1-6 |
| 30-44 | 7 | 5-9 | 1 | 0-1 |
| 45-64 | 3 | 2-5 | 0 | 0-0 |
| 65+ | 3 | 2-4 | 0 | 0-1 |
| Education | ||||
| < High school | 9 | 5-15 | 2 | 0-8 |
| High school | 4 | 3-5 | 0 | 0-1 |
| Some college | 5 | 4-7 | 1 | 0-3 |
| College degree | 5 | 4-6 | 0 | 0-1 |
| Household income | ||||
| < $15,000 | 8 | 4-15 | 2 | 1-5 |
| $15,000 to $24,999 | 10 | 7-14 | 2 | 1-6 |
| $25,000 to $49,999 | 5 | 3-8 | 0 | 0-1 |
| $50,000 to $74,999 | 4 | 2-7 | 0 | 0-0 |
| $75,000+ | 4 | 3-5 | 1 | 0-2 |
| Race | ||||
| White, non-Hispanic | 5 | 4-6 | 0 | 0-1 |
| Black, non-Hispanic | 5 | 3-9 | 1 | 0-2 |
| Hispanic | 9 | 5-17 | 5 | 1-16 |
| Sexual orientation | ||||
| Lesbian, gay or bisexual | NSR | NSR | 4 | 1-13 |
| Straight | NSR | NSR | 0 | 0-0 |
*Excludes missing, don't know and refused
Note: If "NSR" is displayed, then the total response is less than 50 and/or the percentage prevalence is considered "not statistically reliable."
Sexual Orientation and Gender Identity Prevalence per 1,000 Pennsylvania Population,
Pennsylvania Adults, 2014-2018
Color bands around estimates show 95% confidence intervals
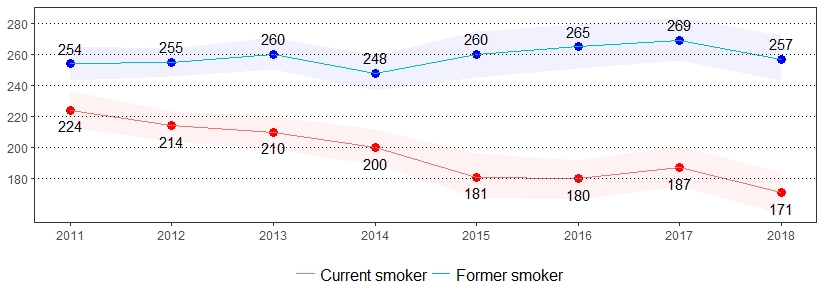
Cigarette smoking is the leading cause of preventable death in the United States, accounting for more than 480,000 deaths each year.37 Quitting smoking greatly reduces the risk of developing smoking-related diseases. Currently, there are more former smokers than current smokers in the United States.38 The estimate(s) of adults who indicated they are a current smoker, former smoker, have quit at least one day in the past year, or currently use chewing tobacco, snuff or snus are shown below.
Tobacco Use, Pennsylvania Adults, 2018
| Current Smoker* ** | Currently Use Chewing Tobacco, Snuff or Snus* *** |
Former Smoker* | Quit at Least 1 Day in the Past Year* ** |
|||||
|---|---|---|---|---|---|---|---|---|
| Demographics | % | CI | % | CI | % | CI | % | CI |
| All adults | 17 | 16-18 | 5 | 4-5 | 26 | 24-27 | 53 | 48-58 |
| Gender | ||||||||
| Male | 17 | 16-19 | 8 | 7-10 | 29 | 27-31 | 53 | 47-60 |
| Female | 17 | 15-19 | 1 | 1-2 | 23 | 21-25 | 53 | 46-59 |
| Age | ||||||||
| 18-29 | 16 | 13-19 | 8 | 6-10 | 8 | 6-10 | 73 | 62-82 |
| 30-44 | 23 | 20-26 | 5 | 4-8 | 23 | 20-27 | 57 | 48-65 |
| 45-64 | 19 | 17-22 | 4 | 3-5 | 29 | 27-32 | 48 | 41-55 |
| 65+ | 10 | 8-12 | 3 | 2-4 | 38 | 35-41 | 34 | 24-45 |
| Education | ||||||||
| < High school | 28 | 22-34 | 9 | 5-14 | 31 | 24-38 | 60 | 46-72 |
| High school | 22 | 20-25 | 6 | 4-7 | 27 | 24-30 | 47 | 41-54 |
| Some college | 16 | 14-18 | 4 | 3-5 | 27 | 24-30 | 57 | 48-66 |
| College degree | 7 | 6-9 | 2 | 2-3 | 21 | 20-23 | 57 | 46-67 |
| Household income | ||||||||
| < $15,000 | 38 | 32-45 | 6 | 4-11 | 20 | 15-25 | 60 | 47-71 |
| $15,000 to $24,999 | 27 | 23-32 | 6 | 4-9 | 28 | 24-32 | 56 | 46-65 |
| $25,000 to $49,999 | 18 | 15-21 | 4 | 3-6 | 31 | 28-35 | 54 | 45-64 |
| $50,000 to $74,999 | 20 | 16-24 | 5 | 3-8 | 24 | 21-28 | 50 | 37-63 |
| $75,000+ | 10 | 8-12 | 5 | 4-7 | 26 | 24-29 | 50 | 39-61 |
| Race | ||||||||
| White, non-Hispanic | 16 | 15-18 | 5 | 4-6 | 28 | 26-30 | 51 | 45-56 |
| Black, non-Hispanic | 24 | 20-28 | 2 | 1-5 | 18 | 15-23 | 65 | 53-75 |
| Hispanic | 19 | 14-25 | 4 | 2-7 | 20 | 14-28 | NSR | NSR |
| Sexual orientation | ||||||||
| Lesbian, gay or bisexual | 40 | 31-49 | 4 | 2-8 | 17 | 12-24 | NSR | NSR |
| Straight | 17 | 15-18 | 5 | 4-6 | 27 | 25-29 | 53 | 48-58 |
*Excludes missing, don't know and refused
**Includes adults who smoke cigarettes every day or some days
***Includes adults who currently use chewing tobacco, snuff or snus every day or some days
Note: If "NSR" is displayed, then the total response is less than 50 and/or the percentage prevalence is considered "not statistically reliable."
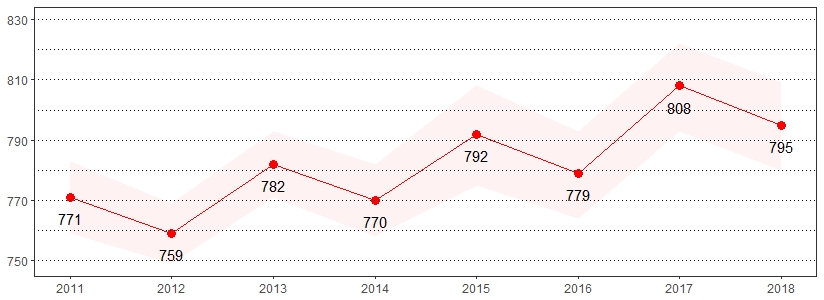
Tobacco Use Prevalence per 1,000 Pennsylvania Population,
Pennsylvania Adults, 2011-2018