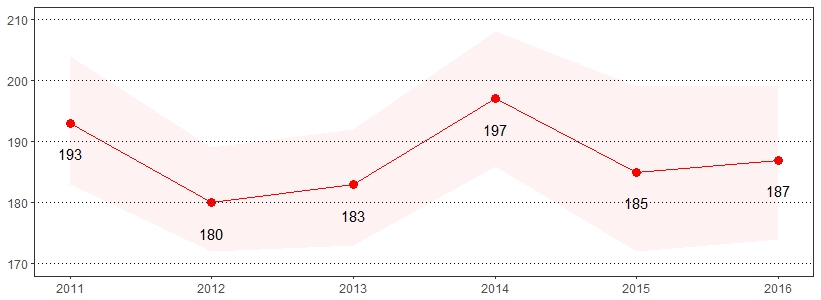
BRFSS respondents were asked to rate their general health as excellent, very good, good, fair or poor. The estimate(s) of adults who reported that their health was fair or poor are shown below.
| Fair or Poor General Health* | ||
|---|---|---|
| Demographics | % | CI |
| All Adults | 17 | 15-18 |
| Gender | ||
| Male | 16 | 15-18 |
| Female | 17 | 15-18 |
| Age | ||
| 18-29 | 8 | 6-11 |
| 30-44 | 12 | 9-14 |
| 45-64 | 20 | 18-22 |
| 65+ | 23 | 21-26 |
| Education | ||
| < High school | 32 | 27-38 |
| High school | 20 | 18-23 |
| Some college | 15 | 13-17 |
| College degree | 6 | 5-7 |
| Household income | ||
| < $15,000 | 40 | 35-46 |
| $15,000 to $24,999 | 30 | 26-34 |
| $25,000 to $49,999 | 18 | 15-21 |
| $50,000 to $74,999 | 10 | 8-13 |
| $75,000+ | 6 | 5-7 |
| Race | ||
| White, non-Hispanic | 15 | 14-17 |
| Black, non-Hispanic | 24 | 20-29 |
| Hispanic | 23 | 17-30 |
*Excludes missing, don't know and refused
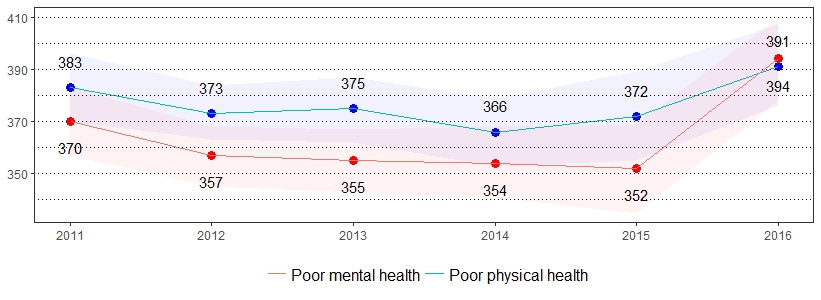
Physically and mentally unhealthy days measure the number of days within the past 30 days that individuals rate their physical and mental health as not good. The estimate(s) of adults who reported one or more physically or mentally unhealthy days are shown below.
| Physical Health Not Good 1+ Days in the Past Month* |
Mental Health Not Good 1+ Days in the Past Month* |
|||
|---|---|---|---|---|
| Demographics | % | CI | % | CI |
| All adults | 39 | 38-41 | 39 | 38-41 |
| Gender | ||||
| Male | 36 | 34-38 | 34 | 32-36 |
| Female | 42 | 40-44 | 44 | 42-47 |
| Age | ||||
| 18-29 | 37 | 33-41 | 52 | 48-56 |
| 30-44 | 36 | 32-39 | 46 | 42-49 |
| 45-64 | 41 | 39-44 | 38 | 36-41 |
| 65+ | 41 | 38-44 | 23 | 21-26 |
| Education | ||||
| < High school | 47 | 41-54 | 47 | 41-54 |
| High school | 42 | 39-45 | 36 | 33-38 |
| Some college | 39 | 36-42 | 43 | 40-46 |
| College degree | 33 | 30-35 | 37 | 35-40 |
| Household income | ||||
| < $15,000 | 62 | 57-68 | 59 | 53-64 |
| $15,000 to $24,999 | 53 | 49-57 | 47 | 43-51 |
| $25,000 to $49,999 | 39 | 36-43 | 37 | 34-41 |
| $50,000 to $74,999 | 35 | 31-39 | 37 | 33-41 |
| $75,000+ | 29 | 26-31 | 35 | 32-38 |
| Race | ||||
| White, non-Hispanic | 38 | 37-40 | 38 | 36-39 |
| Black, non-Hispanic | 43 | 37-48 | 44 | 38-49 |
| Hispanic | 46 | 39-55 | 49 | 41-57 |
*Excludes missing, don't know and refused
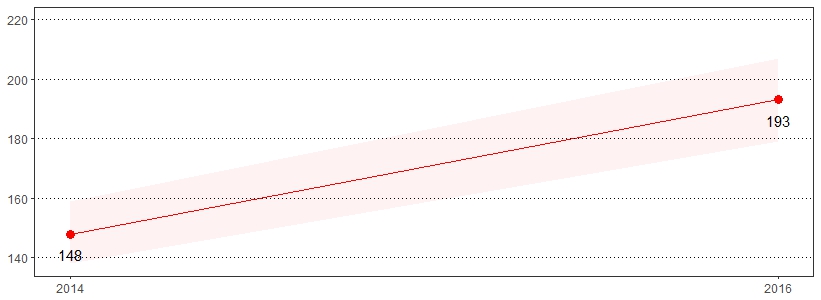
Health care, or insurance coverage, includes private plans and plans such as Health Maintenance Organizations (HMOs) or governmental plans such as Medicare or the Indian Health Service. The estimate(s) of adults ages 18-64 who reported having no health care coverage are shown below.
| No Health Insurance, Age 18-64* | ||
|---|---|---|
| Demographics | % | CI |
| All adults | 9 | 7-10 |
| Gender | ||
| Male | 11 | 9-13 |
| Female | 6 | 5-8 |
| Age | ||
| 18-29 | 11 | 9-15 |
| 30-44 | 11 | 8-13 |
| 45-64 | 5 | 4-7 |
| Education | ||
| < High school | 26 | 19-33 |
| High school | 10 | 8-13 |
| Some college | 5 | 4-7 |
| College degree | 3 | 3-4 |
| Household income | ||
| < $15,000 | 14 | 9-20 |
| $15,000 to $24,999 | 15 | 12-19 |
| $25,000 to $49,999 | 13 | 10-16 |
| $50,000 to $74,999 | 7 | 5-11 |
| $75,000+ | 2 | 2-4 |
| Race | ||
| White, non-Hispanic | 7 | 6-8 |
| Black, non-Hispanic | 13 | 9-17 |
| Hispanic | 22 | 16-30 |
*Excludes missing, don't know and refused
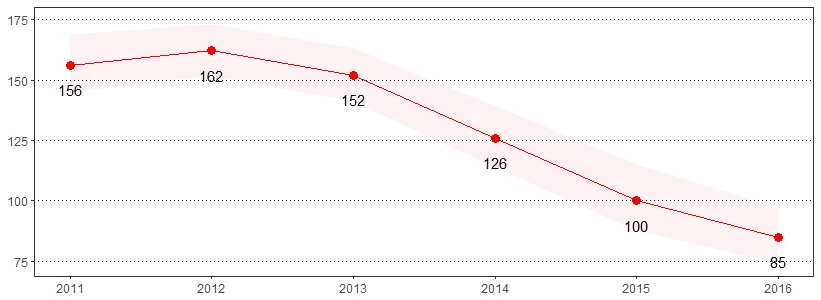
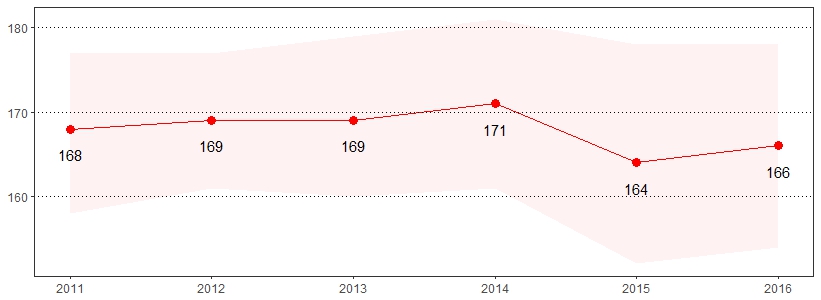
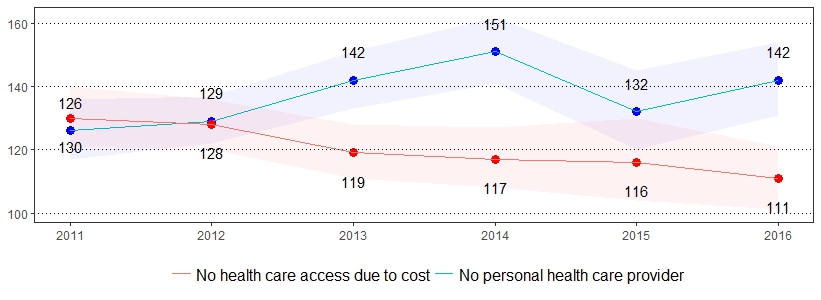
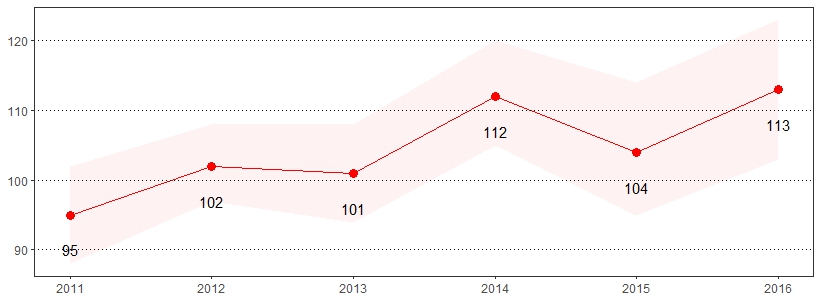
Two additional indicators related to health care access are: 1) not having a personal doctor or health care provider and 2) having had a time during the past 12 months when you needed to see a doctor but could not because of the cost. The estimate(s) of adults who indicated they have no personal health care provider, could not receive care in the past year due to cost, are age 65 and older and have Medicare coverage, and did not take prescribed medication in the past year due to cost are shown below.
| Does Not Have a Personal Health Care Provider* |
Couldn't Receive Care in the Past Year Due to Cost* | Have Medicare, Age 65+* |
Didn't Take Prescribed Medication in the Past Year Due to Cost* |
|||||
|---|---|---|---|---|---|---|---|---|
| Demographics | % | CI | % | CI | % | CI | % | CI |
| All adults | 14 | 13-15 | 11 | 10-12 | 95 | 94-96 | 9 | 8-10 |
| Gender | ||||||||
| Male | 19 | 17-21 | 10 | 9-12 | 95 | 92-96 | 7 | 6-9 |
| Female | 10 | 8-11 | 12 | 10-13 | 95 | 93-97 | 10 | 8-11 |
| Age | ||||||||
| 18-29 | 30 | 26-33 | 10 | 8-13 | NSR | NSR | 7 | 5-10 |
| 30-44 | 21 | 18-24 | 16 | 13-19 | NSR | NSR | 9 | 7-11 |
| 45-64 | 8 | 7-10 | 13 | 11-15 | NSR | NSR | 10 | 9-12 |
| 65+ | 3 | 3-5 | 4 | 3-5 | 95 | 94-96 | 7 | 6-9 |
| Education | ||||||||
| < High school | 18 | 14-24 | 19 | 14-24 | 98 | 94-99 | 15 | 11-20 |
| High school | 14 | 12-16 | 11 | 9-13 | 94 | 91-96 | 8 | 6-9 |
| Some college | 14 | 12-17 | 12 | 10-14 | 95 | 91-97 | 11 | 9-13 |
| College degree | 13 | 11-14 | 7 | 6-8 | 96 | 93-97 | 5 | 4-6 |
| Household income | ||||||||
| < $15,000 | 20 | 15-25 | 19 | 15-25 | 97 | 94-99 | 15 | 11-19 |
| $15,000 to $24,999 | 15 | 12-19 | 18 | 14-21 | 97 | 93-99 | 16 | 13-20 |
| $25,000 to $49,999 | 17 | 14-20 | 14 | 11-16 | 96 | 94-98 | 9 | 7-11 |
| $50,000 to $74,999 | 14 | 11-17 | 11 | 9-14 | 92 | 87-95 | 8 | 6-11 |
| $75,000+ | 10 | 9-12 | 4 | 3-5 | 92 | 85-96 | 4 | 3-5 |
| Race | ||||||||
| White, non-Hispanic | 12 | 11-14 | 10 | 9-11 | 95 | 93-96 | 8 | 7-9 |
| Black, non-Hispanic | 15 | 12-20 | 15 | 12-20 | 96 | 90-99 | 13 | 9-17 |
| Hispanic | 28 | 21-36 | 21 | 15-28 | NSR | NSR | 15 | 10-24 |
*Excludes missing, don't know and refused
Note: If "NSR" is displayed, then the total response is less than 50 and/or the percentage prevalence is considered "not statistically reliable."
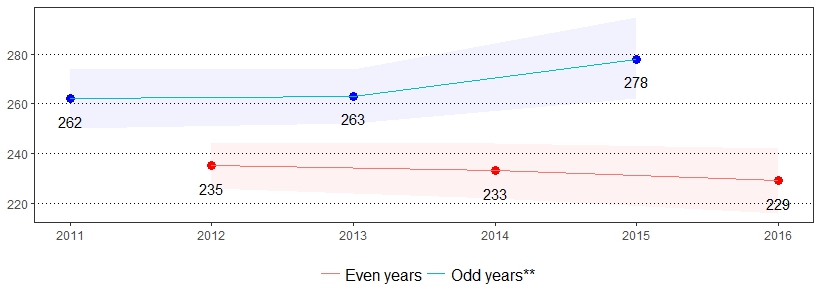
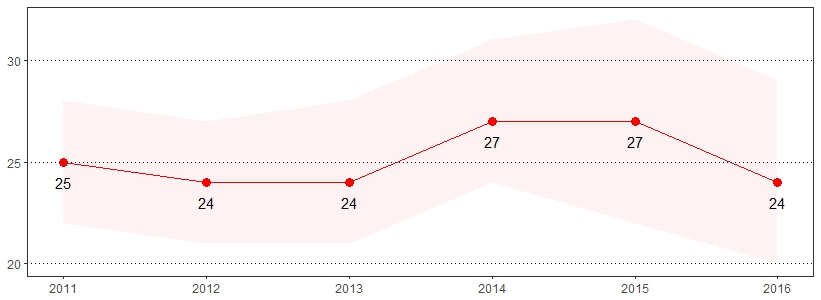
Regular physical activity among adults has been shown to reduce the risk of many diseases including cardiovascular disease, diabetes, colon and breast cancers, and osteoporosis. Keeping physically active also helps to control weight, maintain healthy bones, muscles, and joints, and relieve symptoms of depression.1 The estimate(s) of adults who indicated they participated in no physical activity in the past month are shown below.
| Participated in No Physical Activity in the Past Month* ** | ||
|---|---|---|
| Demographics | % | CI |
| All adults | 23 | 22-24 |
| Gender | ||
| Male | 21 | 19-23 |
| Female | 25 | 23-27 |
| Age | ||
| 18-29 | 14 | 11-17 |
| 30-44 | 17 | 14-20 |
| 45-64 | 25 | 23-28 |
| 65+ | 33 | 30-36 |
| Education | ||
| < High school | 36 | 30-42 |
| High school | 31 | 28-33 |
| Some college | 19 | 17-22 |
| College degree | 10 | 9-12 |
| Household income | ||
| < $15,000 | 36 | 31-42 |
| $15,000 to $24,999 | 33 | 29-36 |
| $25,000 to $49,999 | 25 | 23-29 |
| $50,000 to $74,999 | 21 | 18-25 |
| $75,000+ | 12 | 10-14 |
| Race | ||
| White, non-Hispanic | 22 | 21-24 |
| Black, non-Hispanic | 28 | 24-33 |
| Hispanic | 24 | 17-32 |
*Excludes missing, don't know and refused
**Odd years of survey include the following interviewer instruction: If respondent does not have a "regular job duty" or is retired, they may count the physical activity or exercise they spend the most time doing in a regular month.
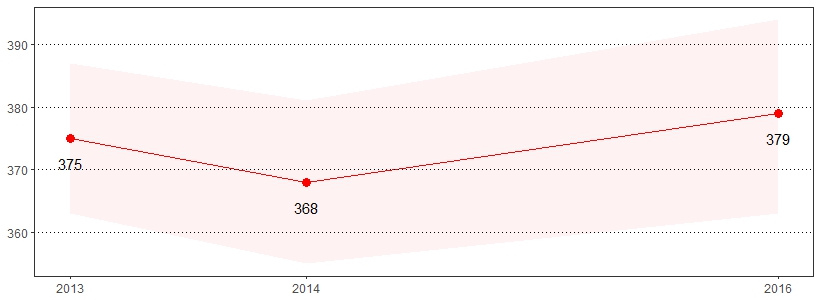
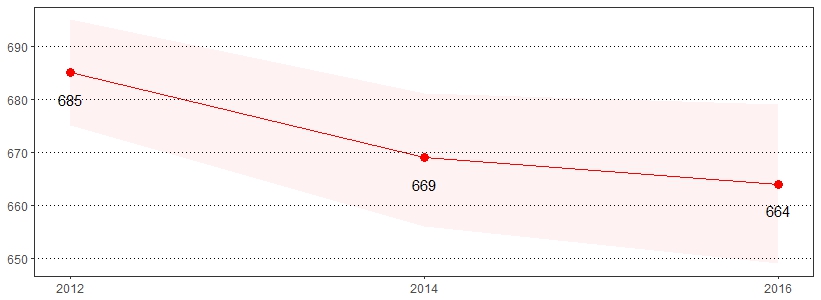
Inadequate sleep can lead to serious health problems, including heart disease, heart attack, heart failure, irregular heartbeat, high blood pressure, stroke and diabetes.2 The estimate(s) of adults who indicated they average six or fewer hours of sleep in a 24-hour period or average seven to nine hours of sleep in a 24-hour period are shown below.
| Average 6 or Fewer Hours of Sleep in a 24-Hour Period* |
Average 7-9 Hours of Sleep in a 24-Hour Period* |
|||
|---|---|---|---|---|
| Demographics | % | CI | % | CI |
| All adults | 38 | 36-39 | 59 | 58-61 |
| Gender | ||||
| Male | 39 | 37-42 | 58 | 56-60 |
| Female | 36 | 34-39 | 60 | 58-63 |
| Age | ||||
| 18-29 | 38 | 34-42 | 59 | 55-63 |
| 30-44 | 43 | 40-47 | 55 | 51-58 |
| 45-64 | 40 | 38-43 | 57 | 54-59 |
| 65+ | 28 | 25-30 | 68 | 65-71 |
| Education | ||||
| < High school | 39 | 33-45 | 54 | 48-60 |
| High school | 41 | 38-44 | 56 | 53-59 |
| Some college | 40 | 37-43 | 57 | 54-60 |
| College degree | 31 | 29-33 | 68 | 65-70 |
| Household income | ||||
| < $15,000 | 43 | 38-49 | 51 | 45-56 |
| $15,000 to $24,999 | 45 | 41-49 | 51 | 46-55 |
| $25,000 to $49,999 | 38 | 35-42 | 60 | 56-63 |
| $50,000 to $74,999 | 38 | 34-42 | 59 | 55-63 |
| $75,000+ | 34 | 31-36 | 65 | 62-67 |
| Race | ||||
| White, non-Hispanic | 36 | 34-37 | 62 | 60-63 |
| Black, non-Hispanic | 48 | 43-54 | 48 | 43-54 |
| Hispanic | 47 | 39-55 | 50 | 42-58 |
*Excludes missing, don't know and refused
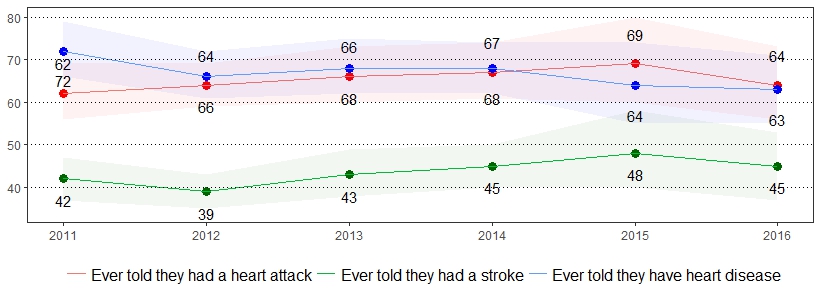
Cardiovascular disease is the leading cause of death for men and women in the United States.3 The estimate(s) of adults age 35 and older who indicated they had a heart attack, heart disease or stroke, ever had a heart attack, ever had angina or heart disease, or ever had a stroke are shown below.
| Ever Told Had Heart Attack, Heart Disease or Stroke* | Ever Told They Had a Heart Attack* | Ever Told They Had Angina or Heart Disease* | Ever Told They Had a Stroke* | |||||
|---|---|---|---|---|---|---|---|---|
| Demographics | % | CI | % | CI | % | CI | % | CI |
| All adults | 13 | 12-14 | 6 | 6-7 | 6 | 6-7 | 4 | 4-5 |
| Gender | ||||||||
| Male | 15 | 14-17 | 9 | 8-11 | 8 | 7-10 | 4 | 3-6 |
| Female | 11 | 9-12 | 4 | 3-5 | 4 | 3-5 | 5 | 4-6 |
| Age | ||||||||
| 35-44 | 3 | 2-5 | 2 | 1-4 | 1 | 0-2 | 1 | 1-3 |
| 45-54 | 9 | 7-11 | 4 | 3-6 | 4 | 3-6 | 3 | 2-5 |
| 55-64 | 14 | 11-16 | 6 | 5-8 | 7 | 6-9 | 5 | 4-7 |
| 65+ | 22 | 19-24 | 11 | 10-13 | 11 | 9-12 | 7 | 6-9 |
| Education | ||||||||
| < High school | 20 | 15-25 | 11 | 8-15 | 9 | 6-13 | 8 | 5-13 |
| High school | 14 | 13-17 | 7 | 6-9 | 7 | 6-8 | 5 | 4-6 |
| Some college | 13 | 11-16 | 7 | 5-9 | 7 | 5-9 | 5 | 3-7 |
| College degree | 7 | 6-8 | 3 | 2-4 | 4 | 3-5 | 2 | 2-3 |
| Household income | ||||||||
| < $15,000 | 21 | 17-27 | 11 | 8-15 | 9 | 6-12 | 9 | 6-13 |
| $15,000 to $24,999 | 22 | 18-27 | 12 | 9-15 | 10 | 8-13 | 10 | 7-14 |
| $25,000 to $49,999 | 14 | 12-17 | 8 | 6-11 | 7 | 5-9 | 4 | 3-6 |
| $50,000 to $74,999 | 10 | 7-13 | 5 | 3-7 | 5 | 3-7 | 3 | 2-5 |
| $75,000+ | 7 | 5-8 | 3 | 2-4 | 4 | 3-6 | 2 | 1-3 |
| Race | ||||||||
| White, non-Hispanic | 13 | 12-14 | 7 | 6-8 | 6 | 6-7 | 5 | 4-6 |
| Black, non-Hispanic | 15 | 11-20 | 6 | 4-10 | 7 | 4-11 | 6 | 4-10 |
| Hispanic | 9 | 5-17 | 4 | 2-11 | 6 | 3-13 | 2 | 0-5 |
*Excludes missing, don't know and refused
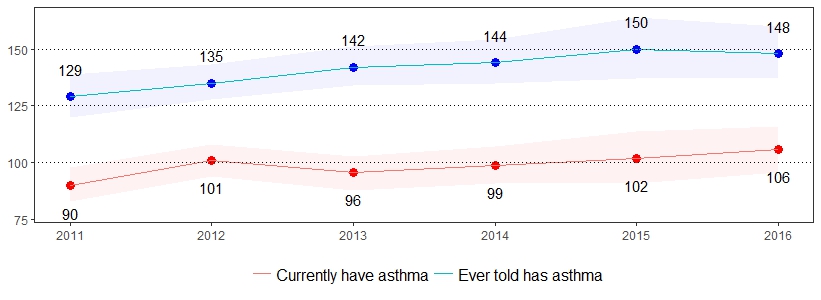
Asthma is a chronic inflammatory disorder of the lungs, characterized by wheezing, coughing, difficulty breathing and chest tightness.4 The estimate(s) of adults who indicated they ever had asthma or currently have asthma are shown below.
| Ever Told Have Asthma* | Currently Has Asthma* | |||
|---|---|---|---|---|
| Demographics | % | CI | % | CI |
| All adults | 15 | 14-16 | 11 | 10-12 |
| Gender | ||||
| Male | 12 | 10-13 | 7 | 6-8 |
| Female | 18 | 16-20 | 14 | 13-16 |
| Age | ||||
| 18-29 | 20 | 17-23 | 12 | 10-15 |
| 30-44 | 16 | 13-19 | 10 | 8-13 |
| 45-64 | 15 | 13-17 | 12 | 10-14 |
| 65+ | 9 | 8-11 | 8 | 6-9 |
| Education | ||||
| < High school | 16 | 12-21 | 14 | 10-18 |
| High school | 13 | 12-15 | 9 | 8-11 |
| Some college | 16 | 14-19 | 12 | 10-14 |
| College degree | 15 | 13-16 | 10 | 8-11 |
| Household income | ||||
| < $15,000 | 25 | 21-30 | 18 | 14-22 |
| $15,000 to $24,999 | 19 | 15-22 | 14 | 11-17 |
| $25,000 to $49,999 | 13 | 11-16 | 10 | 8-13 |
| $50,000 to $74,999 | 12 | 10-15 | 8 | 6-10 |
| $75,000+ | 12 | 11-14 | 8 | 7-10 |
| Race | ||||
| White, non-Hispanic | 13 | 12-14 | 9 | 8-10 |
| Black, non-Hispanic | 21 | 17-26 | 17 | 13-22 |
| Hispanic | 24 | 18-32 | 18 | 13-26 |
*Excludes missing, don't know and refused
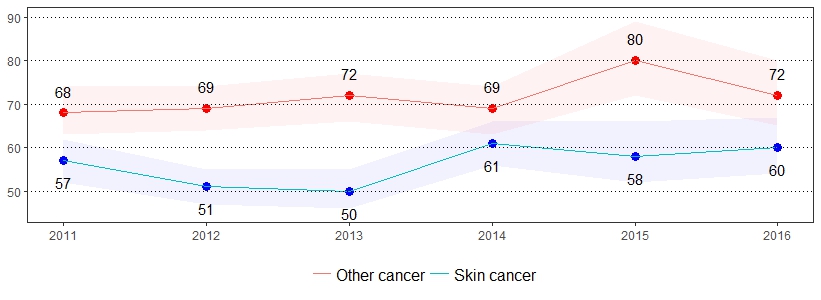
Cancer is the second leading cause of death in the United States.5 The estimate(s) of adults who indicated they were ever told they had skin cancer and ever told they had any other type of cancer are shown below.
| Ever Told Had Skin Cancer* | Ever Told Had Any Other Type of Cancer* |
|||
|---|---|---|---|---|
| Demographics | % | CI | % | CI |
| All adults | 6 | 5-7 | 7 | 6-8 |
| Gender | ||||
| Male | 6 | 5-7 | 6 | 5-7 |
| Female | 6 | 5-7 | 9 | 8-10 |
| Age | ||||
| 18-29 | 0 | 0-1 | 1 | 0-2 |
| 30-44 | 2 | 2-4 | 3 | 2-5 |
| 45-64 | 6 | 5-7 | 8 | 6-9 |
| 65+ | 15 | 13-18 | 16 | 14-18 |
| Education | ||||
| < High school | 4 | 2-6 | 9 | 6-12 |
| High school | 6 | 5-7 | 8 | 6-9 |
| Some college | 6 | 5-7 | 7 | 6-8 |
| College degree | 7 | 6-8 | 6 | 5-7 |
| Household income | ||||
| < $15,000 | 4 | 2-6 | 9 | 6-13 |
| $15,000 to $24,999 | 6 | 5-9 | 13 | 10-16 |
| $25,000 to $49,999 | 7 | 6-9 | 6 | 5-7 |
| $50,000 to $74,999 | 4 | 3-6 | 5 | 4-7 |
| $75,000+ | 7 | 6-8 | 6 | 5-7 |
| Race | ||||
| White, non-Hispanic | 7 | 7-8 | 8 | 7-9 |
| Black, non-Hispanic | 1 | 0-3 | 6 | 4-9 |
| Hispanic | 1 | 0-3 | 2 | 1-6 |
*Excludes missing, don't know and refused
Chronic obstructive pulmonary disease (COPD) is a progressive disease that usually results in coughing, wheezing, shortness of breath, chest tightness and other symptoms.6 The estimate(s) of adults who indicated they were ever told they have COPD, emphysema or chronic bronchitis are shown below.
| Ever Told They Have COPD, Emphysema or Chronic Bronchitis* | ||
|---|---|---|
| Demographics | % | CI |
| All adults | 7 | 7-8 |
| Gender | ||
| Male | 6 | 5-8 |
| Female | 8 | 7-10 |
| Age | ||
| 18-29 | 2 | 1-3 |
| 30-44 | 5 | 3-7 |
| 45-64 | 9 | 8-11 |
| 65+ | 12 | 10-14 |
| Education | ||
| < High school | 13 | 10-18 |
| High school | 10 | 8-11 |
| Some college | 7 | 5-9 |
| College degree | 2 | 2-3 |
| Household income | ||
| < $15,000 | 17 | 13-22 |
| $15,000 to $24,999 | 13 | 10-16 |
| $25,000 to $49,999 | 8 | 6-10 |
| $50,000 to $74,999 | 6 | 4-9 |
| $75,000+ | 3 | 2-4 |
| Race | ||
| White, non-Hispanic | 8 | 7-9 |
| Black, non-Hispanic | 8 | 5-12 |
| Hispanic | 6 | 3-11 |
*Excludes missing, don't know and refused
Arthritis and rheumatism are the leading causes of disability within the United States. Symptoms of arthritis include pain, aching, stiffness and swelling in or around the joints.7 The estimate(s) of adults who indicated they were ever told they have some form of arthritis, rheumatoid arthritis, gout, lupus or fibromyalgia are shown below.
| Ever Told Have Some Form of Arthritis* | ||
|---|---|---|
| Demographics | % | CI |
| All adults | 30 | 29-32 |
| Gender | ||
| Male | 26 | 24-28 |
| Female | 34 | 32-36 |
| Age | ||
| 18-29 | 5 | 3-7 |
| 30-44 | 14 | 12-17 |
| 45-64 | 37 | 35-40 |
| 65+ | 58 | 55-61 |
| Education | ||
| < High school | 36 | 30-42 |
| High school | 34 | 32-36 |
| Some college | 30 | 28-33 |
| College degree | 22 | 21-24 |
| Household income | ||
| < $15,000 | 41 | 36-47 |
| $15,000 to $24,999 | 41 | 37-45 |
| $25,000 to $49,999 | 34 | 31-38 |
| $50,000 to $74,999 | 26 | 22-29 |
| $75,000+ | 20 | 18-23 |
| Race | ||
| White, non-Hispanic | 32 | 31-34 |
| Black, non-Hispanic | 27 | 22-32 |
| Hispanic | 20 | 14-28 |
*Excludes missing, don't know and refused
Depression is a common and treatable medical disorder that is more common among individuals with chronic conditions such as obesity, diabetes and arthritis.8 The estimate(s) of adults who indicated they were ever told they have a depressive disorder, including depression, major depression, minor depression or dysthymia are shown below.
| Ever Told They Have Some Form of Depressive Disorder* | ||
|---|---|---|
| Demographics | % | CI |
| All adults | 19 | 17-20 |
| Gender | ||
| Male | 14 | 12-15 |
| Female | 23 | 21-25 |
| Age | ||
| 18-29 | 20 | 17-24 |
| 30-44 | 21 | 18-24 |
| 45-64 | 21 | 19-23 |
| 65+ | 12 | 10-14 |
| Education | ||
| < High school | 26 | 21-31 |
| High school | 17 | 15-19 |
| Some college | 23 | 20-26 |
| College degree | 13 | 12-15 |
| Household income | ||
| < $15,000 | 36 | 31-42 |
| $15,000 to $24,999 | 27 | 23-30 |
| $25,000 to $49,999 | 19 | 16-22 |
| $50,000 to $74,999 | 16 | 13-19 |
| $75,000+ | 12 | 10-14 |
| Race | ||
| White, non-Hispanic | 18 | 17-20 |
| Black, non-Hispanic | 20 | 16-25 |
| Hispanic | 23 | 16-31 |
*Excludes missing, don't know and refused
Kidney disease is a condition in which the kidneys are damaged and are unable to filter blood properly. Adults with diabetes or hypertension are at an increased risk of kidney disease.9 The estimate(s) of adults who indicated they were ever told they have a kidney disease are shown below.
| Ever Told Have Kidney Disease* | ||
|---|---|---|
| Demographics | % | CI |
| All adults | 2 | 2-3 |
| Gender | ||
| Male | 2 | 2-3 |
| Female | 2 | 2-3 |
| Age | ||
| 18-29 | 1 | 0-2 |
| 30-44 | 1 | 1-2 |
| 45-64 | 3 | 2-4 |
| 65+ | 5 | 4-6 |
| Education | ||
| < High school | 4 | 2-6 |
| High school | 3 | 2-4 |
| Some college | 2 | 2-3 |
| College degree | 1 | 1-2 |
| Household income | ||
| < $15,000 | 7 | 5-10 |
| $15,000 to $24,999 | 4 | 3-6 |
| $25,000 to $49,999 | 2 | 1-3 |
| $50,000 to $74,999 | 2 | 1-3 |
| $75,000+ | 1 | 1-2 |
| Race | ||
| White, non-Hispanic | 2 | 2-3 |
| Black, non-Hispanic | 5 | 3-7 |
| Hispanic | 3 | 1-6 |
*Excludes missing, don't know and refused
Diabetes is the seventh leading cause of death in the United States.5 The estimate(s) of adults who indicated they were ever told they have diabetes are shown below.
| Ever Told Have Diabetes* | ||
|---|---|---|
| Demographics | % | CI |
| All adults | 11 | 10-12 |
| Gender | ||
| Male | 12 | 11-14 |
| Female | 11 | 9-12 |
| Age | ||
| 18-29 | 1 | 1-2 |
| 30-44 | 4 | 3-5 |
| 45-64 | 13 | 12-15 |
| 65+ | 24 | 22-27 |
| Education | ||
| < High school | 21 | 16-26 |
| High School | 13 | 11-15 |
| Some college | 10 | 8-11 |
| College degree | 7 | 6-8 |
| Household income | ||
| < $15,000 | 15 | 12-19 |
| $15,000 to $24,999 | 18 | 15-21 |
| $25,000 to $49,999 | 13 | 11-16 |
| $50,000 to $74,999 | 11 | 9-14 |
| $75,000+ | 6 | 5-8 |
| Race | ||
| White, non-Hispanic | 11 | 10-12 |
| Black, non-Hispanic | 15 | 12-19 |
| Hispanic | 12 | 7-20 |
*Excludes missing, don't know and refused
Many diseases, such as diabetes, heart disease, HIV, and cancer, (as well as some eating disorders) are linked with oral health problems.10 The estimate(s) of adults who indicated they visited a dentist in the past year or had any permanent teeth removed are shown below.
| Visited Dentist in the Past Year* | Had Any Permanent Teeth Removed* ** | |||
|---|---|---|---|---|
| Demographics | % | CI | % | CI |
| All adults | 66 | 65-68 | 47 | 45-48 |
| Gender | ||||
| Male | 63 | 61-65 | 46 | 44-48 |
| Female | 69 | 67-71 | 47 | 45-49 |
| Age | ||||
| 18-29 | 64 | 60-68 | 16 | 13-19 |
| 30-44 | 64 | 60-67 | 33 | 29-36 |
| 45-64 | 70 | 68-72 | 56 | 53-58 |
| 65+ | 66 | 63-69 | 76 | 73-78 |
| Education | ||||
| < High school | 43 | 37-49 | 66 | 59-72 |
| High school | 60 | 57-63 | 55 | 53-58 |
| Some college | 71 | 68-73 | 44 | 41-47 |
| College degree | 81 | 79-82 | 29 | 27-32 |
| Household income | ||||
| < $15,000 | 41 | 36-47 | 63 | 58-69 |
| $15,000 to $24,999 | 52 | 48-56 | 60 | 56-64 |
| $25,000 to $49,999 | 60 | 57-64 | 53 | 50-57 |
| $50,000 to $74,999 | 73 | 69-76 | 46 | 42-50 |
| $75,000+ | 82 | 79-84 | 31 | 28-34 |
| Race | ||||
| White, non-Hispanic | 69 | 67-70 | 47 | 45-48 |
| Black, non-Hispanic | 56 | 50-61 | 54 | 49-59 |
| Hispanic | 64 | 56-71 | 40 | 32-48 |
*Excludes missing, don't know and refused
**Due to tooth decay or gum disease
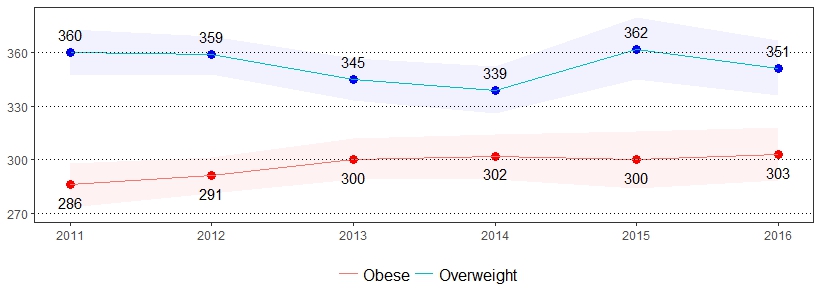
Being overweight or obese has been proven to increase the risk of many diseases and health conditions such as high blood pressure, diabetes, coronary heart disease, stroke, gallbladder disease, high cholesterol, and some forms of cancer.11 The estimate(s) of adults who indicated they were overweight, obese or overweight and obese are shown below.
| Overweight* (BMI 25-29) |
Obese* (BMI >= 30) |
Overweight & Obese* (BMI >= 25) |
||||
|---|---|---|---|---|---|---|
| Demographics | % | CI | % | CI | % | CI |
| All adults | 35 | 34-37 | 30 | 29-32 | 65 | 64-67 |
| Gender | ||||||
| Male | 40 | 38-42 | 31 | 29-33 | 71 | 69-74 |
| Female | 30 | 28-32 | 29 | 27-31 | 59 | 57-62 |
| Age | ||||||
| 18-29 | 28 | 25-33 | 19 | 16-22 | 48 | 43-52 |
| 30-44 | 33 | 30-37 | 32 | 29-36 | 65 | 62-69 |
| 45-64 | 36 | 34-39 | 36 | 33-38 | 72 | 70-74 |
| 65+ | 40 | 38-44 | 30 | 28-33 | 71 | 68-74 |
| Education | ||||||
| < High school | 33 | 27-39 | 35 | 29-42 | 68 | 61-74 |
| High school | 35 | 32-37 | 35 | 32-37 | 69 | 67-72 |
| Some college | 36 | 33-39 | 30 | 28-33 | 66 | 63-69 |
| College degree | 37 | 34-39 | 22 | 20-24 | 58 | 56-61 |
| Household income | ||||||
| < $15,000 | 31 | 26-36 | 35 | 30-41 | 66 | 60-71 |
| $15,000 to $24,999 | 34 | 30-38 | 35 | 31-39 | 69 | 65-72 |
| $25,000 to $49,999 | 35 | 31-38 | 34 | 30-37 | 68 | 65-71 |
| $50,000 tot $74,999 | 35 | 31-38 | 34 | 30-38 | 68 | 64-72 |
| $75,000+ | 38 | 35-41 | 25 | 23-28 | 63 | 60-66 |
| Race | ||||||
| White, non-Hispanic | 36 | 34-38 | 30 | 28-31 | 66 | 64-67 |
| Black, non-Hispanic | 34 | 29-40 | 39 | 33-44 | 73 | 68-78 |
| Hispanic | 27 | 20-34 | 37 | 29-45 | 64 | 55-71 |
*Excludes missing, don't know and refused
Note: The Body Mass Index (BMI), which describes relative weight for height, is significantly correlated with total body fat content. BMI is calculated as mass (kg)/height2 (m2) and estimated using pounds and inches by [weight (pound)/height2 (inches2)] x 703. Individuals with a BMI of 25 to 29.9 are considered overweight, while individuals with a BMI >= 30 are considered obese.
Vision loss means that a person's eyesight is not corrected to a "normal" level. Vision loss can be caused by damage to the eye itself, by the eye being shaped incorrectly or even by a problem in the brain.13
Approximately 15 percent of American adults (37.5 million) report some trouble hearing.12 The estimate(s) of adults who indicated they were deaf or have serious difficulty hearing or were ever blind or have serious difficulty seeing, even when wearing glasses, are shown below.
| Deaf or Serious Difficulty Hearing* | Blind or Serious Difficulty Seeing, Even With Glasses* |
|||
|---|---|---|---|---|
| Demographics | % | CI | % | CI |
| All adults | 5 | 5-6 | 4 | 3-4 |
| Gender | ||||
| Male | 7 | 6-8 | 3 | 3-4 |
| Female | 4 | 3-5 | 4 | 3-5 |
| Age | ||||
| 18-29 | 1 | 1-2 | 2 | 1-3 |
| 30-44 | 1 | 1-2 | 2 | 1-4 |
| 45-64 | 5 | 4-7 | 5 | 4-6 |
| 65+ | 13 | 11-15 | 4 | 3-6 |
| Education | ||||
| < High school | 7 | 5-11 | 9 | 6-14 |
| High school | 7 | 6-8 | 3 | 3-4 |
| Some college | 5 | 4-6 | 3 | 2-4 |
| College degree | 3 | 2-4 | 2 | 1-2 |
| Household income | ||||
| < $15,000 | 8 | 5-11 | 9 | 6-13 |
| $15,000 to $24,999 | 8 | 7-11 | 6 | 4-8 |
| $25,000 to $49,999 | 7 | 5-8 | 5 | 4-7 |
| $50,000 to $74,999 | 3 | 2-5 | 1 | 1-3 |
| $75,000+ | 3 | 2-4 | 1 | 1-2 |
| Race | ||||
| White, non-Hispanic | 6 | 5-6 | 3 | 2-4 |
| Black, non-Hispanic | 3 | 2-5 | 4 | 3-7 |
| Hispanic | 4 | 2-10 | 8 | 4-14 |
*Excludes missing, don't know and refused
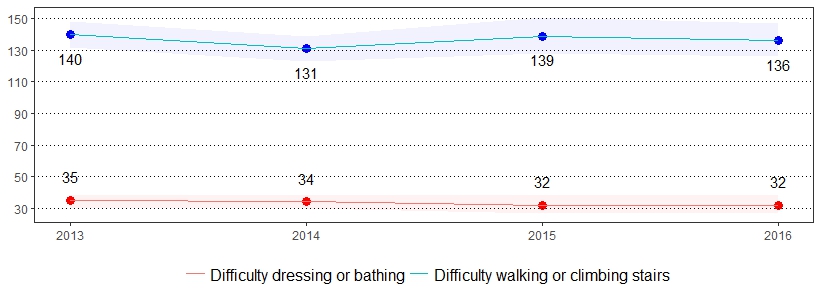
Impairment is an absence of, or significant difference in, a person's body structure or function or mental functioning.14 One in 25 United States adults reported having difficulty dressing or bathing, and one in 15 United States adults reported having difficulty doing errands alone due to a health condition.15 The estimate(s) of adults who indicated they had difficulty making decisions due to a health condition, had difficulty walking or climbing stairs, had difficulty dressing or bathing, or had difficulty doing errands alone due to a health condition are shown below.
| Have Difficulty Making Decisions Due to Health Condition* ** |
Have Difficulty Walking or Climbing Stairs* |
Have Difficulty Dressing or Bathing* | Have Difficulty Doing Errands Alone Due to Health Condition* ** |
|||||
|---|---|---|---|---|---|---|---|---|
| Demographics | % | CI | % | CI | % | CI | % | CI |
| All adults | 10 | 9-11 | 14 | 13-15 | 3 | 3-4 | 6 | 6-7 |
| Gender | ||||||||
| Male | 9 | 7-10 | 12 | 10-13 | 4 | 3-5 | 5 | 4-6 |
| Female | 11 | 10-13 | 15 | 14-17 | 3 | 2-4 | 7 | 6-9 |
| Age | ||||||||
| 18-29 | 10 | 8-13 | 2 | 1-3 | 1 | 0-2 | 5 | 3-7 |
| 30-44 | 10 | 8-13 | 5 | 4-7 | 2 | 1-3 | 5 | 3-6 |
| 45-64 | 11 | 10-13 | 17 | 15-19 | 4 | 3-5 | 7 | 6-8 |
| 65+ | 7 | 5-9 | 27 | 24-30 | 5 | 4-7 | 9 | 7-11 |
| Education | ||||||||
| < High school | 20 | 16-25 | 29 | 24-35 | 10 | 7-14 | 15 | 11-20 |
| High school | 11 | 9-12 | 16 | 14-18 | 3 | 2-4 | 7 | 5-8 |
| Some college | 10 | 8-12 | 13 | 11-15 | 3 | 2-4 | 6 | 5-8 |
| College degree | 4 | 3-5 | 5 | 4-6 | 1 | 1-2 | 2 | 2-3 |
| Household income | ||||||||
| < $15,000 | 27 | 22-32 | 38 | 33-44 | 9 | 6-12 | 22 | 17-27 |
| $15,000 to $24,999 | 18 | 15-21 | 26 | 23-30 | 8 | 6-10 | 13 | 10-16 |
| $25,000 to $49,999 | 10 | 8-12 | 14 | 12-16 | 3 | 2-5 | 6 | 5-9 |
| $50,000 to $74,999 | 6 | 4-8 | 7 | 5-9 | 2 | 1-3 | 3 | 2-4 |
| $75,000+ | 4 | 3-5 | 4 | 3-5 | 1 | 0-1 | 1 | 1-1 |
| Race | ||||||||
| White, non-Hispanic | 9 | 8-10 | 13 | 12-14 | 3 | 2-3 | 6 | 5-7 |
| Black, non-Hispanic | 12 | 9-15 | 21 | 17-26 | 4 | 2-6 | 9 | 6-13 |
| Hispanic | 17 | 11-25 | 15 | 10-21 | 9 | 5-16 | 11 | 7-18 |
*Excludes missing, don't know and refused
**Includes physical, mental or emotional problems
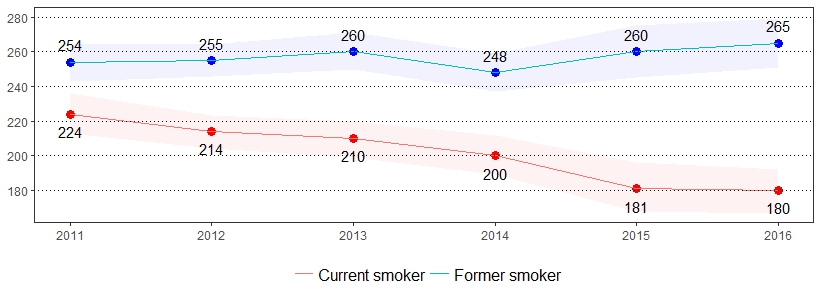
Cigarette smoking is the leading cause of preventable death in the United States, accounting for more than 480,000 deaths each year.16 Quitting smoking greatly reduces the risk of developing smoking-related diseases. Currently, there are more former smokers than current smokers in the United States.17 The estimate(s) of adults who indicated they are a current smoker, former smoker, have quit at least one day in the past year, or currently use chewing tobacco, snuff or snus are shown below.
| Current Smoker* ** | Currently Use Chewing Tobacco, Snuff or Snus* *** |
Former Smoker* | Quit at Least 1 Day in the Past Year* ** |
|||||
|---|---|---|---|---|---|---|---|---|
| Demographics | % | CI | % | CI | % | CI | % | CI |
| All adults | 18 | 17-19 | 4 | 3-5 | 26 | 25-28 | 51 | 47-56 |
| Gender | ||||||||
| Male | 20 | 18-22 | 8 | 7-9 | 29 | 27-31 | 55 | 48-62 |
| Female | 16 | 14-18 | 0 | 0-1 | 24 | 22-26 | 47 | 41-53 |
| Age | ||||||||
| 18-29 | 17 | 14-20 | 5 | 3-7 | 10 | 8-13 | NSR | NSR |
| 30-44 | 24 | 21-27 | 5 | 4-7 | 23 | 20-26 | 49 | 40-58 |
| 45-64 | 22 | 20-24 | 5 | 4-6 | 28 | 25-30 | 46 | 39-53 |
| 65+ | 7 | 6-9 | 2 | 1-3 | 43 | 40-46 | 50 | 37-62 |
| Education | ||||||||
| < High school | 32 | 26-38 | 6 | 4-10 | 21 | 16-26 | 52 | 40-63 |
| High school | 22 | 20-25 | 6 | 5-7 | 29 | 27-32 | 51 | 44-57 |
| Some college | 18 | 15-20 | 3 | 2-5 | 27 | 25-30 | 51 | 43-59 |
| College degree | 6 | 5-8 | 2 | 1-2 | 25 | 23-27 | 53 | 41-65 |
| Household income | ||||||||
| < $15,000 | 36 | 30-42 | 3 | 1-5 | 20 | 15-25 | 62 | 50-72 |
| $15,000 to $24,999 | 27 | 23-31 | 5 | 3-7 | 27 | 24-31 | 49 | 39-59 |
| $25,000 to $49,999 | 21 | 18-24 | 4 | 3-6 | 30 | 27-33 | 50 | 41-60 |
| $50,000 to $74,999 | 16 | 13-19 | 6 | 4-8 | 28 | 24-31 | 49 | 37-60 |
| $75,000+ | 10 | 8-11 | 4 | 3-5 | 27 | 24-30 | 47 | 35-59 |
| Race | ||||||||
| White, non-Hispanic | 17 | 16-19 | 5 | 4-5 | 29 | 27-30 | 48 | 43-53 |
| Black, non-Hispanic | 24 | 20-29 | 2 | 1-4 | 16 | 12-20 | NSR | NSR |
| Hispanic | 19 | 13-27 | 1 | 0-4 | 25 | 19-34 | NSR | NSR |
*Excludes missing, don't know and refused
**Includes adults who smoke cigarettes every day or some days
***Includes adults who currently use chewing tobacco, snuff or snus every day or some days
Note: If "NSR" is displayed, then the total response is less than 50 and/or the percentage prevalence is considered "not statistically reliable."
Approximately 9 million (3.7 percent) United States adults reported using an electronic cigarette or vaping product on a regular basis.18 The estimate(s) of adults who indicated they ever used an e-cigarette or other electronic vaping product, currently use an e-cigarette or other electronic vaping product every day, or currently use an e-cigarette or other electronic vaping product some days are shown below.
| Ever Used E-Cigarette or Other Electronic Vaping Product* | Currently Use E-Cigarette or Other Electronic Vaping Product Every Day* | Currently Use E-Cigarette or Other Electronic Vaping Product Some Days* | ||||
|---|---|---|---|---|---|---|
| Demographics | % | CI | % | CI | % | CI |
| All adults | 21 | 20-23 | 6 | 5-8 | 14 | 11-16 |
| Gender | ||||||
| Male | 24 | 22-26 | 7 | 5-10 | 13 | 10-16 |
| Female | 19 | 17-20 | 5 | 3-8 | 14 | 11-18 |
| Age | ||||||
| 18-29 | 38 | 34-42 | 5 | 3-9 | 15 | 11-19 |
| 30-44 | 27 | 24-30 | 9 | 6-14 | 12 | 9-18 |
| 45-64 | 18 | 16-20 | 5 | 3-7 | 13 | 9-17 |
| 65+ | 6 | 4-7 | 8 | 4-15 | 13 | 7-22 |
| Education | ||||||
| < High school | 28 | 22-34 | 5 | 2-12 | 12 | 7-20 |
| High school | 22 | 20-25 | 8 | 5-12 | 15 | 11-19 |
| Some college | 25 | 22-28 | 5 | 3-9 | 15 | 11-20 |
| College degree | 13 | 12-15 | 5 | 3-8 | 9 | 6-13 |
| Household income | ||||||
| < $15,000 | 32 | 27-37 | 7 | 3-15 | 12 | 8-19 |
| $15,000 to $24,999 | 25 | 22-29 | 5 | 3-10 | 14 | 9-21 |
| $25,000 to $49,999 | 23 | 20-26 | 5 | 2-8 | 17 | 12-23 |
| $50,000 to $74,999 | 20 | 17-24 | 7 | 4-13 | 12 | 8-19 |
| $75,000+ | 16 | 14-19 | 7 | 4-12 | 12 | 8-19 |
| Race | ||||||
| White, non-Hispanic | 21 | 19-22 | 7 | 5-10 | 14 | 12-17 |
| Black, non-Hispanic | 21 | 17-26 | 2 | 1-6 | 12 | 6-21 |
| Hispanic | 29 | 22-37 | NSR | NSR | 9 | 4-18 |
*Excludes missing, don't know and refused
Note: If "NSR" is displayed, then the total response is less than 50 and/or the percentage prevalence is considered "not statistically reliable."
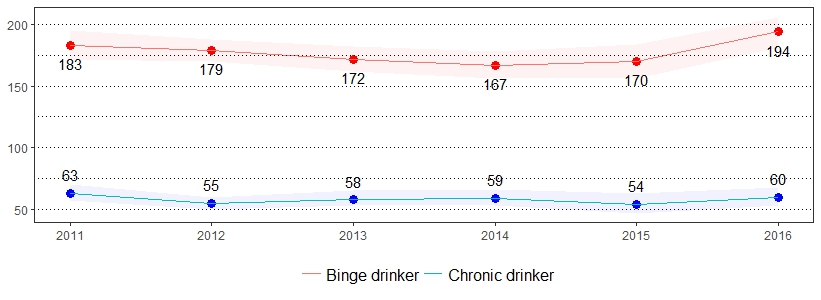
Excessive alcohol use contributes to approximately 88,000 deaths each year within the United States.19 The estimate(s) of adults who indicated binge drinking, chronic drinking or being at risk for problem drinking are shown below.
| Binge Drinking* ** | At Risk for Problem Drinking* *** | Chronic Drinking* **** | ||||
|---|---|---|---|---|---|---|
| Demographics | % | CI | % | CI | % | CI |
| All adults | 19 | 18-21 | 7 | 6-8 | 6 | 5-7 |
| Gender | ||||||
| Male | 25 | 23-27 | 7 | 6-8 | 10 | 8-11 |
| Female | 14 | 12-15 | 6 | 5-8 | 3 | 2-4 |
| Age | ||||||
| 18-29 | 30 | 26-33 | 8 | 6-10 | 6 | 4-8 |
| 30-44 | 26 | 23-29 | 7 | 6-9 | 6 | 5-8 |
| 45-64 | 18 | 16-20 | 7 | 6-9 | 7 | 6-8 |
| 65+ | 6 | 5-8 | 4 | 3-6 | 5 | 4-7 |
| Education | ||||||
| < High school | 13 | 10-18 | 8 | 5-12 | 7 | 4-11 |
| High school | 19 | 17-21 | 5 | 4-7 | 6 | 5-7 |
| Some college | 21 | 18-23 | 7 | 6-9 | 6 | 5-8 |
| College degree | 21 | 19-23 | 8 | 7-10 | 6 | 5-7 |
| Household income | ||||||
| < $15,000 | 15 | 12-20 | 5 | 3-8 | 6 | 4-9 |
| $15,000 to $24,999 | 17 | 14-21 | 5 | 4-8 | 4 | 3-6 |
| $25,000 to $49,999 | 18 | 15-21 | 7 | 5-9 | 6 | 4-8 |
| $50,000 to $74,999 | 20 | 17-23 | 6 | 5-9 | 6 | 5-9 |
| $75,000+ | 25 | 22-27 | 9 | 7-11 | 8 | 6-9 |
| Race | ||||||
| White, non-Hispanic | 20 | 18-21 | 7 | 6-8 | 6 | 6-7 |
| Black, non-Hispanic | 15 | 12-19 | 4 | 2-7 | 3 | 2-7 |
| Hispanic | 23 | 17-30 | 6 | 3-10 | 6 | 3-11 |
*Excludes missing, don't know and refused
**Defined as having five or more drinks on one occasion for men and having four or more drinks on one occasion for women
***Defined as adult men having more than two drinks per day and adult women having more than one drink per day
****Defined as having an average of two drinks or more every day for the past 30 days
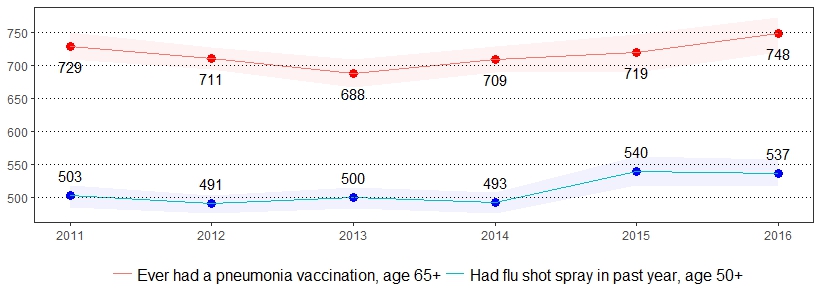
Adult immunizations against influenza and pneumococcal disease are important health indicators that need to be routinely monitored.20 The estimate(s) of adults who indicated they had a flu shot or flu vaccine that was sprayed in the nose in the past year, are age 65 and older and ever had a pneumonia vaccination, or did not have a tetanus shot since 2005 are shown below.
| Had Flu Shot or Flu Vaccine Sprayed in Nose in the Past Year* | Ever Had Pneumonia Vaccination, Age 65+* | Did Not Have a Tetanus Shot Since 2005* |
||||
|---|---|---|---|---|---|---|
| Demographics | % | CI | % | CI | % | CI |
| All adults | 43 | 41-44 | 75 | 72-77 | 39 | 37-40 |
| Gender | ||||||
| Male | 39 | 36-41 | 75 | 70-78 | 35 | 33-37 |
| Female | 46 | 44-49 | 75 | 71-78 | 42 | 40-45 |
| Age | ||||||
| 18-29 | 30 | 26-34 | NSR | NSR | 28 | 24-32 |
| 30-44 | 32 | 29-36 | NSR | NSR | 33 | 29-36 |
| 45-64 | 42 | 40-45 | NSR | NSR | 40 | 37-42 |
| 65+ | 66 | 63-68 | 75 | 72-77 | 53 | 50-56 |
| Education | ||||||
| < High school | 34 | 29-41 | 65 | 54-74 | 51 | 44-57 |
| High school | 40 | 38-43 | 75 | 71-79 | 43 | 40-46 |
| Some college | 41 | 38-44 | 75 | 70-80 | 36 | 33-39 |
| College degree | 51 | 48-53 | 81 | 77-85 | 30 | 28-33 |
| Household income | ||||||
| < $15,000 | 38 | 33-44 | 76 | 66-83 | 49 | 43-55 |
| $15,000 to $24,999 | 44 | 40-48 | 73 | 67-79 | 43 | 39-48 |
| $25,000 to $49,999 | 40 | 37-44 | 77 | 72-81 | 43 | 39-46 |
| $50,000 to $74,999 | 41 | 37-45 | 74 | 65-81 | 36 | 32-40 |
| $75,000+ | 44 | 42-47 | 77 | 71-83 | 31 | 28-34 |
| Race | ||||||
| White, non-Hispanic | 43 | 42-45 | 75 | 72-78 | 37 | 35-38 |
| Black, non-Hispanic | 44 | 39-50 | 67 | 55-77 | 49 | 43-54 |
| Hispanic | 32 | 24-41 | NSR | NSR | 48 | 40-57 |
*Excludes missing, don't know and refused
Note: If "NSR" is displayed, then the total response is less than 50 and/or the percentage prevalence is considered "not statistically reliable."
Falls are the leading cause of fatal and non-fatal injuries for older Americans.21 The estimate(s) of adults age 45 and older who indicated they have fallen in the past 12 months or have been injured by a fall in the past 12 months are shown below.
| Have Fallen in the Past 12 Months* ** | Have Been Injured by a Fall in the Past 12 Months* |
|||
|---|---|---|---|---|
| Demographics | % | CI | % | CI |
| All adults | 30 | 28-32 | 12 | 11-14 |
| Gender | ||||
| Male | 28 | 26-31 | 10 | 8-12 |
| Female | 31 | 29-34 | 15 | 13-17 |
| Age | ||||
| 45-64 | 31 | 29-33 | 13 | 12-15 |
| 65+ | 29 | 26-31 | 11 | 9-13 |
| Education | ||||
| < High school | 31 | 24-39 | 17 | 12-24 |
| High school | 30 | 27-33 | 13 | 11-15 |
| Some college | 33 | 29-37 | 13 | 10-16 |
| College degree | 27 | 24-29 | 9 | 8-11 |
| Household income | ||||
| < $15,000 | 41 | 34-47 | 21 | 16-28 |
| $15,000 to $24,999 | 35 | 30-40 | 16 | 12-21 |
| $25,000 to $49,999 | 32 | 28-36 | 14 | 11-18 |
| $50,000 to $74,999 | 32 | 28-37 | 12 | 9-15 |
| $75,000+ | 24 | 21-27 | 8 | 6-10 |
| Race | ||||
| White, non-Hispanic | 30 | 28-32 | 12 | 10-13 |
| Black, non-Hispanic | 30 | 24-37 | 17 | 12-23 |
| Hispanic | NSR | NSR | NSR | NSR |
*Excludes missing, don't know and refused
**A fall that limited regular activities for at least 1 day or required a trip to go see a doctor
Note: If "NSR" is displayed, then the total response is less than 50 and/or the percentage prevalence is considered "not statistically reliable."
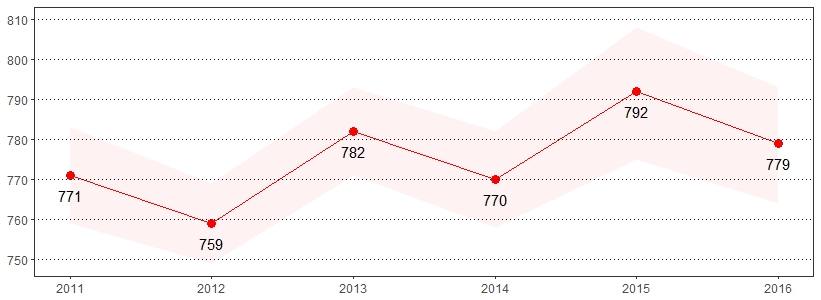
Seat belt use is the most effective way to save lives and reduce injuries in crashes.22 Seat belts have saved an estimated 318,000 lives between 1975 and 2013.23 The estimate(s) of adults who indicated they always use seatbelts when driving or riding in a car, always or nearly always use seatbelts when driving or riding in a car, or seldom or never use seatbelts when driving or riding in a car are shown below.
| Always Use Seatbelts When Driving or Riding in a Car* | Always or Nearly Always Use Seatbelts When Driving or Riding in a Car* | Seldom or Never Use Seatbelts When Driving or Riding in a Car* | ||||
|---|---|---|---|---|---|---|
| Demographics | % | CI | % | CI | % | CI |
| All adults | 78 | 76-79 | 89 | 87-90 | 5 | 5-6 |
| Gender | ||||||
| Male | 72 | 70-74 | 85 | 83-86 | 8 | 7-9 |
| Female | 83 | 82-85 | 92 | 91-93 | 3 | 2-4 |
| Age | ||||||
| 18-29 | 72 | 68-76 | 86 | 83-89 | 6 | 5-9 |
| 30-44 | 75 | 72-79 | 87 | 84-89 | 5 | 4-7 |
| 45-64 | 79 | 77-81 | 89 | 87-90 | 6 | 5-7 |
| 65+ | 83 | 81-86 | 92 | 90-93 | 4 | 3-6 |
| Education | ||||||
| < High school | 67 | 60-73 | 84 | 79-88 | 9 | 6-12 |
| High school | 74 | 72-77 | 85 | 83-87 | 7 | 6-8 |
| Some college | 77 | 74-79 | 88 | 86-90 | 5 | 4-7 |
| College degree | 89 | 87-90 | 96 | 95-96 | 2 | 1-2 |
| Household income | ||||||
| < $15,000 | 72 | 66-77 | 84 | 79-88 | 6 | 4-9 |
| $15,000 to $24,999 | 74 | 70-78 | 85 | 82-88 | 8 | 6-11 |
| $25,000 to $49,999 | 73 | 70-76 | 86 | 83-88 | 6 | 5-8 |
| $50,000 to $74,999 | 76 | 73-80 | 87 | 84-90 | 6 | 4-8 |
| $75,000+ | 84 | 81-86 | 93 | 91-95 | 4 | 3-5 |
| Race | ||||||
| White, non-Hispanic | 78 | 76-79 | 89 | 87-90 | 5 | 5-6 |
| Black, non-Hispanic | 75 | 70-80 | 86 | 81-89 | 5 | 4-8 |
| Hispanic | 83 | 76-88 | 93 | 88-96 | 3 | 1-6 |
*Excludes missing, don't know and refused
In 2014, 9,967 people were killed in alcohol-impaired driving crashes, accounting for nearly one-third (31 percent) of all traffic-related deaths in the United States.24 The estimate(s) of adults who indicated they have driven in the past month with perhaps too much to drink are shown below.
| Driven in the Past Month with Perhaps Too Much to Drink* | ||
|---|---|---|
| Demographics | % | CI |
| All adults | 4 | 3-5 |
| Gender | ||
| Male | 6 | 4-7 |
| Female | 2 | 1-3 |
| Age | ||
| 18-29 | 3 | 2-5 |
| 30-44 | 5 | 4-8 |
| 45-64 | 5 | 4-6 |
| 65+ | 2 | 1-3 |
| Education | ||
| < High school | 5 | 2-13 |
| High school | 5 | 3-7 |
| Some college | 3 | 2-5 |
| College degree | 4 | 3-5 |
| Household income | ||
| < $15,000 | 2 | 1-5 |
| $15,000 to $24,999 | 4 | 2-8 |
| $25,000 to $49,999 | 3 | 2-4 |
| $50,000 to $74,999 | 5 | 4-8 |
| $75,000+ | 5 | 3-6 |
| Race | ||
| White, non-Hispanic | 4 | 3-5 |
| Black, non-Hispanic | 4 | 2-8 |
| Hispanic | 6 | 3-15 |
*Excludes missing, don't know and refused
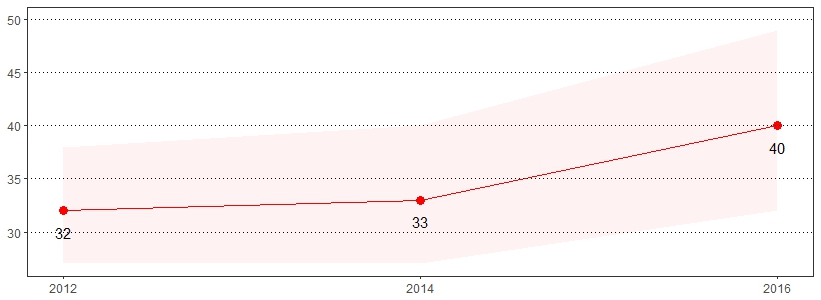
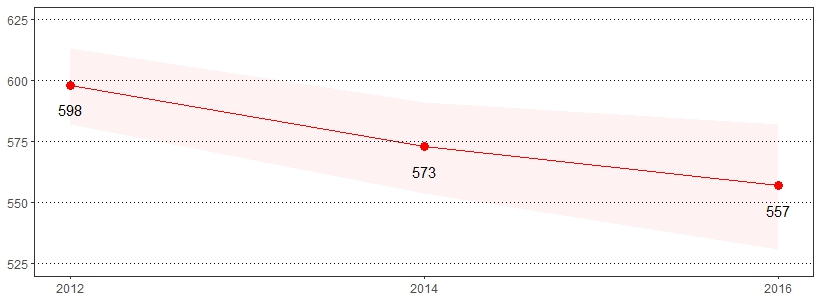
Breast cancer is the most common form of cancer and the second leading cause of cancer death among women.25 The estimate(s) of women age 40 and older who indicated they ever had a mammogram or had a mammogram in the past year are shown below.
| Ever Had a Mammogram* | Had a Mammogram in the Past Year* | |||
|---|---|---|---|---|
| Demographics | % | CI | % | CI |
| Gender | ||||
| Female | 92 | 90-93 | 56 | 53-58 |
| Age | ||||
| 40-49 | 77 | 72-82 | 48 | 42-54 |
| 50-64 | 96 | 94-97 | 58 | 54-62 |
| 65-74 | 96 | 92-98 | 66 | 61-71 |
| 75+ | 97 | 94-98 | 49 | 43-55 |
| Education | ||||
| < High school | 88 | 79-94 | 44 | 34-54 |
| High school | 93 | 90-95 | 54 | 50-58 |
| Some college | 91 | 87-94 | 56 | 51-61 |
| College degree | 93 | 90-95 | 64 | 60-68 |
| Household income | ||||
| < $15,000 | 87 | 80-91 | 43 | 35-51 |
| $15,000 to $24,999 | 95 | 91-97 | 49 | 43-56 |
| $25,000 to $49,999 | 93 | 89-96 | 57 | 51-62 |
| $50,000 to $74,999 | 87 | 80-92 | 54 | 47-61 |
| $75,000+ | 93 | 90-96 | 64 | 59-69 |
| Race | ||||
| White, non-Hispanic | 93 | 91-94 | 55 | 52-58 |
| Black, non-Hispanic | 91 | 84-96 | 65 | 57-73 |
| Hispanic | NSR | NSR | NSR | NSR |
*Excludes missing, don't know and refused
Note: If "NSR" is displayed, then the total response is less than 50 and/or the percentage prevalence is considered "not statistically reliable."
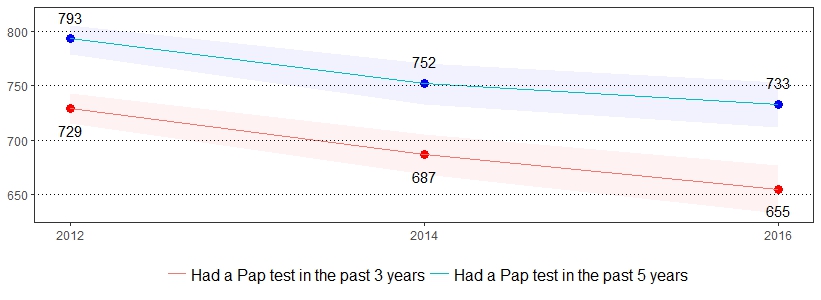
A pap test is a screening procedure for cervical cancer. It tests for the presence of precancerous or cancerous cells on the cervix, the opening of the uterus.26 Cervical cancer tends to occur in midlife. Most cases are found in women between the ages of 20-50.27 The estimate(s) of women who indicated they ever had a pap test, had a pap test in the past three years, had a pap test in the past five years, or ever had a hysterectomy are shown below.
| Ever Had a Pap Test* | Had a Pap Test in the Past 3 Years* | Had a Pap Test in the Past 5 Years* | Ever Had a Hysterectomy* | |||||
|---|---|---|---|---|---|---|---|---|
| Demographics | % | CI | % | CI | % | CI | % | CI |
| Gender | ||||||||
| Female | 90 | 88-92 | 66 | 63-68 | 73 | 71-75 | 20 | 18-21 |
| Age | ||||||||
| 18-29 | 62 | 55-68 | 55 | 49-61 | 59 | 52-65 | 0 | 0-3 |
| 30-44 | 96 | 94-98 | 84 | 80-88 | 91 | 88-94 | 4 | 3-7 |
| 45-64 | 98 | 97-99 | 71 | 68-74 | 79 | 76-82 | 24 | 21-27 |
| 65+ | 94 | 91-96 | 48 | 44-52 | 59 | 55-63 | 42 | 38-46 |
| Education | ||||||||
| < High school | 89 | 82-94 | 50 | 41-59 | 58 | 49-66 | 30 | 22-38 |
| High school | 88 | 84-91 | 58 | 54-62 | 69 | 65-72 | 25 | 22-28 |
| Some college | 88 | 85-91 | 67 | 63-71 | 74 | 70-77 | 17 | 15-20 |
| College degree | 96 | 93-97 | 79 | 76-82 | 84 | 81-87 | 12 | 10-14 |
| Household income | ||||||||
| < $15,000 | 84 | 78-89 | 53 | 46-60 | 62 | 55-69 | 27 | 21-33 |
| $15,000 to $24,999 | 88 | 83-92 | 53 | 48-59 | 63 | 57-68 | 27 | 23-32 |
| $25,000 to $49,999 | 92 | 89-95 | 62 | 57-66 | 72 | 68-76 | 23 | 19-27 |
| $50,000 to $74,999 | 92 | 86-96 | 73 | 67-78 | 80 | 75-85 | 16 | 12-20 |
| $75,000+ | 93 | 89-96 | 80 | 76-83 | 84 | 80-88 | 12 | 10-14 |
| Race | ||||||||
| White, non-Hispanic | 92 | 90-93 | 65 | 62-67 | 73 | 71-75 | 21 | 19-23 |
| Black, non-Hispanic | 85 | 77-91 | 71 | 63-77 | 76 | 68-82 | 18 | 14-24 |
| Hispanic | 88 | 79-93 | 73 | 61-82 | 80 | 69-87 | 8 | 3-17 |
*Excludes missing, don't know and refused
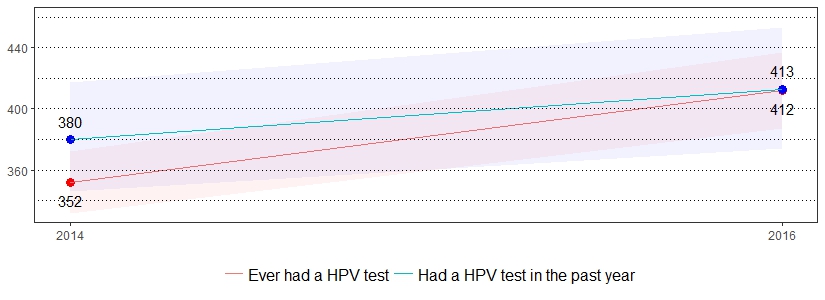
It is estimated that about 11,771 new cases of HPV-associated cervical cancer are diagnosed in the United States each year.28 The estimate(s) of women who indicated they ever had a HPV test or had a HPV test in the past year are shown below.
| Ever Had a HPV Test* | Had a HPV Test in the Past Year* | |||
|---|---|---|---|---|
| Demographics | % | CI | % | CI |
| Gender | ||||
| Female | 41 | 39-44 | 41 | 37-45 |
| Age | ||||
| 18-29 | 45 | 39-51 | 55 | 46-64 |
| 30-44 | 68 | 63-74 | 37 | 31-44 |
| 45-64 | 41 | 37-45 | 37 | 31-44 |
| 65+ | 16 | 13-19 | 33 | 24-44 |
| Education | ||||
| < High school | 31 | 22-40 | NSR | NSR |
| High school | 34 | 30-39 | 39 | 32-47 |
| Some college | 43 | 38-48 | 43 | 35-51 |
| College degree | 52 | 48-56 | 41 | 36-47 |
| Household income | ||||
| < $15,000 | 39 | 32-47 | 40 | 29-53 |
| $15,000 to $24,999 | 38 | 32-45 | 41 | 31-52 |
| $25,000 to $49,999 | 43 | 38-49 | 40 | 32-49 |
| $50,000 to $74,999 | 46 | 39-52 | 32 | 24-42 |
| $75,000+ | 49 | 44-54 | 45 | 38-53 |
| Race | ||||
| White, non-Hispanic | 39 | 37-42 | 38 | 34-43 |
| Black, non-Hispanic | 48 | 40-56 | 55 | 44-65 |
| Hispanic | 50 | 37-63 | NSR | NSR |
*Excludes missing, don't know and refused
Note: If "NSR" is displayed, then the total response is less than 50 and/or the percentage prevalence is considered "not statistically reliable."
About one out of seven men will be diagnosed with prostate cancer during his lifetime and about one out of 39 men will die of prostate cancer.29 Prostate-specific antigen (PSA) is a protein produced by both cancerous and noncancerous tissue in the prostate.30 The estimate(s) of men age 50 and older who indicated that a health professional ever recommended a PSA test, ever had a PSA test, or had a PSA test in the past year are shown below.
| Health Professional Ever Recommended PSA Test* | Ever Had a PSA Test* | Had a PSA Test in the Past Year* | ||||
|---|---|---|---|---|---|---|
| Demographics | % | CI | % | CI | % | CI |
| Gender | ||||||
| Male | 64 | 61-67 | 67 | 64-70 | 59 | 56-63 |
| Age | ||||||
| 50-64 | 58 | 54-62 | 58 | 53-62 | 53 | 48-59 |
| 65-74 | 73 | 67-78 | 80 | 74-84 | 69 | 62-75 |
| 75+ | 68 | 61-75 | 79 | 72-85 | 60 | 51-68 |
| Education | ||||||
| < High school | 52 | 40-64 | 50 | 38-62 | NSR | NSR |
| High school | 62 | 57-66 | 63 | 58-68 | 64 | 57-70 |
| Some college | 65 | 59-71 | 73 | 68-79 | 58 | 51-66 |
| College degree | 72 | 67-76 | 75 | 71-79 | 61 | 55-66 |
| Household income | ||||||
| < $15,000 | 52 | 39-65 | 55 | 41-68 | NSR | NSR |
| $15,000 to $24,999 | 55 | 47-63 | 55 | 46-63 | 58 | 47-68 |
| $25,000 to $49,999 | 64 | 58-70 | 68 | 62-74 | 64 | 55-71 |
| $50,000 to $74,999 | 62 | 54-69 | 65 | 57-71 | 59 | 49-68 |
| $75,000+ | 69 | 64-74 | 74 | 69-78 | 58 | 52-65 |
| Race | ||||||
| White, non-Hispanic | 64 | 61-67 | 68 | 65-71 | 62 | 58-65 |
| Black, non-Hispanic | 67 | 55-77 | 71 | 58-81 | NSR | NSR |
| Hispanic | NSR | NSR | NSR | NSR | NSR | NSR |
*Excludes missing, don't know and refused
Note: If "NSR" is displayed, then the total response is less than 50 and/or the percentage prevalence is considered "not statistically reliable."
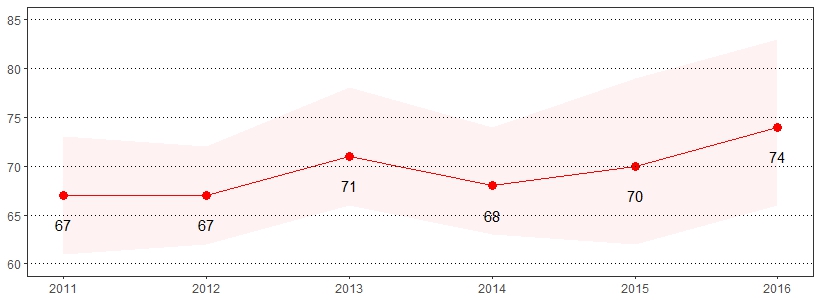
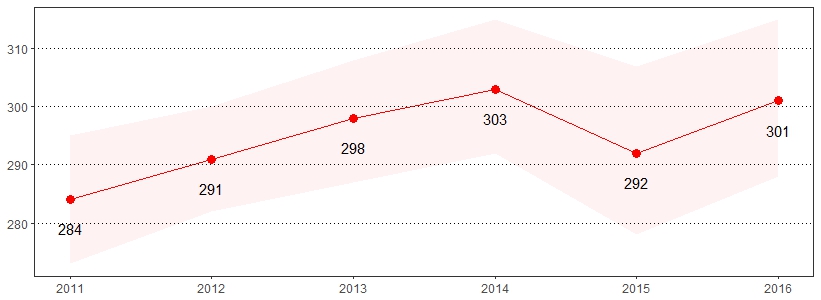
Approximately, one in 21 men (4.7 percent) and one in 23 women (4.4 percent) will develop colorectal cancer in their lifetime. Colorectal cancer is the third leading cause of cancer-related deaths in women and second leading cause of cancer-related deaths in men.31 Colonoscopy and sigmoidoscopy both use a thin flexible tube with a camera at the end to look at the colon. Colonoscopy examines the entire colon, while sigmoidoscopy is a partial exam that only covers the left side of the colon.32 The estimate(s) of adults age 50 and older who indicated they had a blood stool test in the past year, ever had a sigmoidoscopy or colonoscopy, or had a sigmoidoscopy or colonoscopy in the past 10 years are shown below.
| Had a Blood Stool Test in the Past Year* | Ever Had a Sigmoidoscopy or Colonoscopy* | Had a Sigmoidoscopy or Colonoscopy in the Past 10 Years* | ||||
|---|---|---|---|---|---|---|
| Demographics | % | CI | % | CI | % | CI |
| All adults | 8 | 7-9 | 71 | 70-73 | 67 | 65-69 |
| Gender | ||||||
| Male | 7 | 6-9 | 72 | 69-75 | 68 | 65-71 |
| Female | 8 | 6-9 | 71 | 68-74 | 66 | 63-68 |
| Age | ||||||
| 50-64 | 5 | 4-7 | 66 | 63-68 | 62 | 59-64 |
| 65-74 | 10 | 8-13 | 80 | 77-83 | 74 | 71-78 |
| 75+ | 10 | 7-13 | 77 | 72-81 | 71 | 66-75 |
| Education | ||||||
| < High school | 6 | 3-10 | 58 | 50-66 | 55 | 46-62 |
| High school | 9 | 7-11 | 69 | 66-72 | 65 | 62-68 |
| Some college | 8 | 6-11 | 75 | 72-79 | 69 | 65-73 |
| College degree | 6 | 4-8 | 78 | 76-81 | 74 | 71-77 |
| Household income | ||||||
| < $15,000 | 8 | 5-12 | 55 | 48-62 | 52 | 44-59 |
| $15,000 to $24,999 | 10 | 7-14 | 65 | 60-70 | 58 | 52-63 |
| $25,000 to $49,999 | 8 | 6-11 | 72 | 68-75 | 67 | 63-71 |
| $50,000 to $74,999 | 6 | 4-9 | 75 | 70-80 | 70 | 65-75 |
| $75,000+ | 5 | 4-7 | 78 | 75-81 | 74 | 71-77 |
| Race | ||||||
| White, non-Hispanic | 8 | 6-9 | 72 | 70-74 | 67 | 65-69 |
| Black, non-Hispanic | 8 | 5-13 | 70 | 63-77 | 67 | 60-74 |
| Hispanic | NSR | NSR | NSR | NSR | NSR | NSR |
*Excludes missing, don't know and refused
Note: If "NSR" is displayed, then the total response is less than 50 and/or the percentage prevalence is considered "not statistically reliable."
Human Immunodeficiency Virus (HIV) is a virus spread through certain body fluids that attacks the body's immune system, specifically the CD4 cells, often called T cells.33 The estimate(s) of adults age 18-64 who indicated they were ever tested for HIV (except during a blood donation) or that an HIV situation applies to them are shown below.
| Ever Tested for HIV, Except Blood Donation* | HIV Situation Applies* ** | |||
|---|---|---|---|---|
| Demographics | % | CI | % | CI |
| All adults | 40 | 38-42 | 7 | 7-9 |
| Gender | ||||
| Male | 37 | 34-40 | 9 | 8-11 |
| Female | 43 | 40-46 | 6 | 5-7 |
| Age | ||||
| 18-29 | 32 | 28-36 | 14 | 11-17 |
| 30-44 | 57 | 53-60 | 8 | 7-11 |
| 45-64 | 33 | 31-36 | 3 | 2-4 |
| Education | ||||
| < High school | 45 | 37-53 | 10 | 6-15 |
| High school | 36 | 33-39 | 8 | 6-10 |
| Some college | 42 | 38-45 | 8 | 6-11 |
| College degree | 41 | 38-44 | 5 | 4-7 |
| Household income | ||||
| < $15,000 | 53 | 46-60 | 13 | 9-19 |
| $15,000 to $24,999 | 51 | 46-57 | 12 | 9-17 |
| $25,000 to $49,999 | 41 | 37-45 | 9 | 7-12 |
| $50,000 to $74,999 | 34 | 30-39 | 5 | 3-7 |
| $75,000+ | 37 | 34-40 | 6 | 4-8 |
| Race | ||||
| White, non-Hispanic | 33 | 31-35 | 7 | 6-8 |
| Black, non-Hispanic | 69 | 63-75 | 11 | 7-15 |
| Hispanic | 67 | 59-75 | 11 | 7-18 |
*Excludes missing, don't know and refused
**Defined as having used intravenous drugs, having been treated for a sexually transmitted or venereal disease, having given or received money or drugs in exchange for sex, had anal sex without a condom or had four or more sex partners in the past year
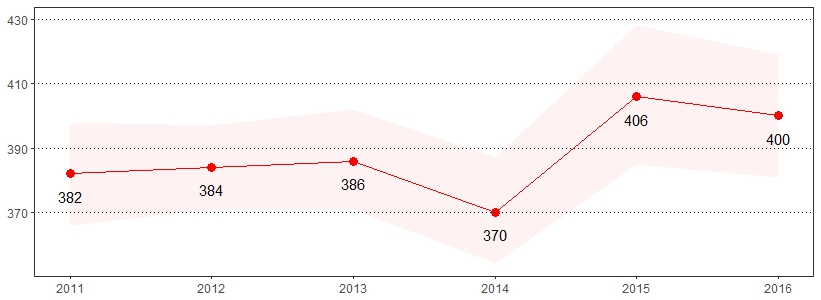
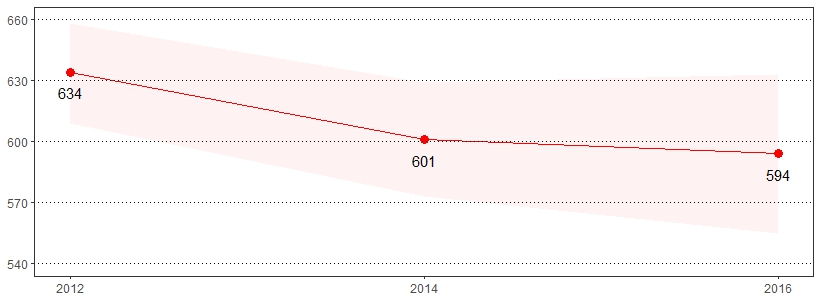
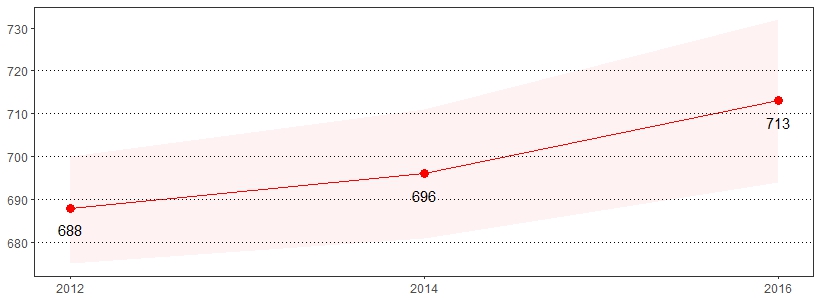
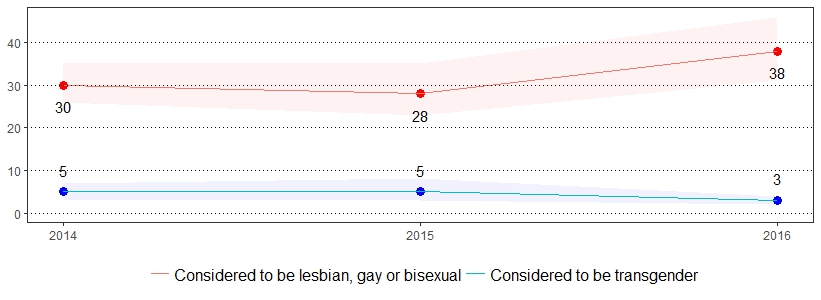
Approximately, 1.4 million adults in the United States identify as transgender.34 The estimate(s) of adults who indicated they were considered lesbian, gay or bisexual or were considered transgender are shown below.
| Considered to be Lesbian, Gay or Bisexual* | Considered to be Transgender* | |||
|---|---|---|---|---|
| Demographics | % | CI | % | CI |
| All adults | 4 | 3-5 | 0 | 0-0 |
| Gender | ||||
| Male | 3 | 3-5 | 0 | 0-0 |
| Female | 4 | 3-5 | 0 | 0-1 |
| Age | ||||
| 18-29 | 9 | 7-13 | 1 | 0-1 |
| 30-44 | 3 | 2-5 | 0 | 0-1 |
| 45-64 | 2 | 2-4 | 0 | 0-0 |
| 65+ | 2 | 1-3 | 0 | 0-1 |
| Education | ||||
| < High school | 5 | 3-9 | 1 | 0-2 |
| High school | 3 | 2-5 | 0 | 0-0 |
| Some college | 5 | 3-7 | 0 | 0-1 |
| College degree | 3 | 2-5 | 0 | 0-1 |
| Household income | ||||
| < $15,000 | 7 | 4-11 | 0 | 0-1 |
| $15,000 to $24,999 | 5 | 3-8 | 0 | 0-1 |
| $25,000 to $49,999 | 4 | 2-6 | 0 | 0-1 |
| $50,000 to $74,999 | 2 | 1-4 | 0 | 0-0 |
| $75,000+ | 3 | 2-4 | 0 | 0-0 |
| Race | ||||
| White, non-Hispanic | 3 | 3-4 | 0 | 0-0 |
| Black, non-Hispanic | 5 | 3-9 | 0 | 0-2 |
| Hispanic | 8 | 4-16 | 0 | 0-3 |
*Excludes missing, don't know and refused
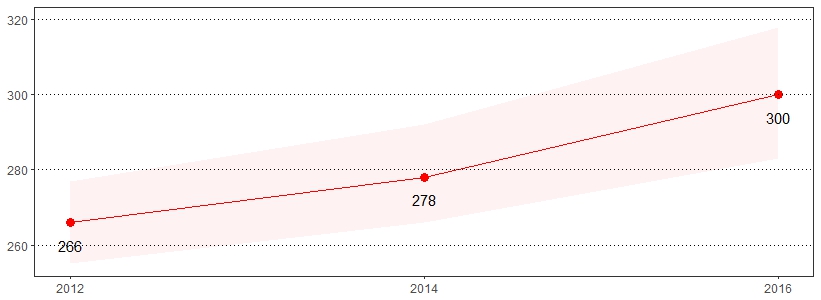
Approximately 266.1 million courses of antibiotics are dispensed to outpatients in United States community pharmacies.35 At least 30 percent of antibiotics prescribed in the outpatient setting are unnecessary, meaning that no antibiotic was needed at all.36 The estimate(s) of adults who indicated they were prescribed antibiotic medicine to treat an illness in the past year are shown below.
| Prescribed Antibiotic Medicine to Treat an Illness in the Past Year* | ||
|---|---|---|
| Demographics | % | CI |
| All adults | 41 | 39-43 |
| Gender | ||
| Male | 36 | 34-39 |
| Female | 45 | 43-47 |
| Age | ||
| 18-29 | 36 | 31-41 |
| 30-44 | 41 | 37-45 |
| 45-64 | 41 | 39-44 |
| 65+ | 44 | 41-47 |
| Education | ||
| < High school | 41 | 35-48 |
| High school | 41 | 38-44 |
| Some college | 42 | 39-46 |
| College degree | 40 | 37-42 |
| Household income | ||
| < $15,000 | 44 | 38-50 |
| $15,000 to $24,999 | 47 | 42-51 |
| $25,000 to $49,999 | 40 | 37-44 |
| $50,000 to $74,999 | 40 | 36-44 |
| $75,000+ | 39 | 36-42 |
| Race | ||
| White, non-Hispanic | 42 | 40-44 |
| Black, non-Hispanic | 40 | 34-46 |
| Hispanic | 34 | 25-44 |
*Excludes missing, don't know and refused
Adverse childhood experiences (ACEs) are potentially traumatic events that can have negative, lasting effects on health and well-being.37 Nearly one in eight children (12 percent) have had three or more negative life experiences associated with levels of stress that can harm their health and development.38 The estimate(s) of adults who indicated that, before age 18, they lived with anyone who was depressed, mentally ill or suicidal; before age 18, they lived with anyone who was a problem drinker or alcoholic; before age 18, they lived with anyone who used illegal street drugs or abused prescription medications; or before age 18, they lived with anyone who was sentenced to serve time in a prison, jail or other correctional facility are shown below.
| Before Age 18, Lived With Anyone Who Was Depressed, Mentally Ill or Suicidal* |
Before Age 18, Lived With Anyone Who Was a Problem Drinker or Alcoholic* |
Before Age 18, Lived With Anyone Who Used Illegal Street Drugs or Abused Prescriptions* |
Before Age 18, Lived With Anyone Who Was Sentenced to Serve Time in Prison* |
|||||
|---|---|---|---|---|---|---|---|---|
| Demographics | % | CI | % | CI | % | CI | % | CI |
| All adults | 19 | 18-21 | 23 | 21-24 | 11 | 10-12 | 8 | 7-9 |
| Gender | ||||||||
| Male | 17 | 15-19 | 21 | 19-23 | 11 | 9-13 | 8 | 6-9 |
| Female | 21 | 19-23 | 25 | 23-27 | 10 | 9-12 | 7 | 6-9 |
| Age | ||||||||
| 18-29 | 32 | 28-37 | 24 | 20-28 | 20 | 17-24 | 14 | 11-18 |
| 30-44 | 25 | 21-28 | 27 | 23-30 | 17 | 14-20 | 11 | 8-13 |
| 45-64 | 18 | 16-20 | 24 | 22-27 | 8 | 7-10 | 6 | 5-7 |
| 65+ | 7 | 6-9 | 17 | 15-19 | 2 | 1-2 | 2 | 1-3 |
| Education | ||||||||
| < High school | 21 | 15-27 | 32 | 26-38 | 16 | 11-21 | 15 | 11-21 |
| High school | 14 | 12-16 | 21 | 19-23 | 9 | 7-10 | 8 | 6-10 |
| Some college | 26 | 23-30 | 26 | 23-29 | 13 | 11-16 | 8 | 6-10 |
| College degree | 19 | 17-21 | 19 | 17-21 | 9 | 7-10 | 3 | 2-4 |
| Household income | ||||||||
| < $15,000 | 25 | 20-31 | 34 | 28-40 | 15 | 11-20 | 15 | 11-20 |
| $15,000 to $24,999 | 17 | 14-21 | 25 | 21-30 | 13 | 10-17 | 12 | 9-16 |
| $25,000 to $49,999 | 19 | 16-22 | 22 | 19-25 | 10 | 8-12 | 9 | 7-12 |
| $50,000 to $74,999 | 19 | 16-22 | 21 | 18-25 | 10 | 8-13 | 6 | 4-8 |
| $75,000+ | 21 | 18-23 | 21 | 18-24 | 10 | 8-12 | 4 | 3-5 |
| Race | ||||||||
| White, non-Hispanic | 19 | 17-20 | 22 | 20-24 | 9 | 8-11 | 6 | 5-7 |
| Black, non-Hispanic | 17 | 13-23 | 26 | 21-32 | 15 | 11-20 | 14 | 10-19 |
| Hispanic | 33 | 24-43 | 32 | 24-42 | 17 | 11-26 | 21 | 14-30 |
*Excludes missing, don't know and refused